Static Maps
A selection of static maps. Full list on GitHub.
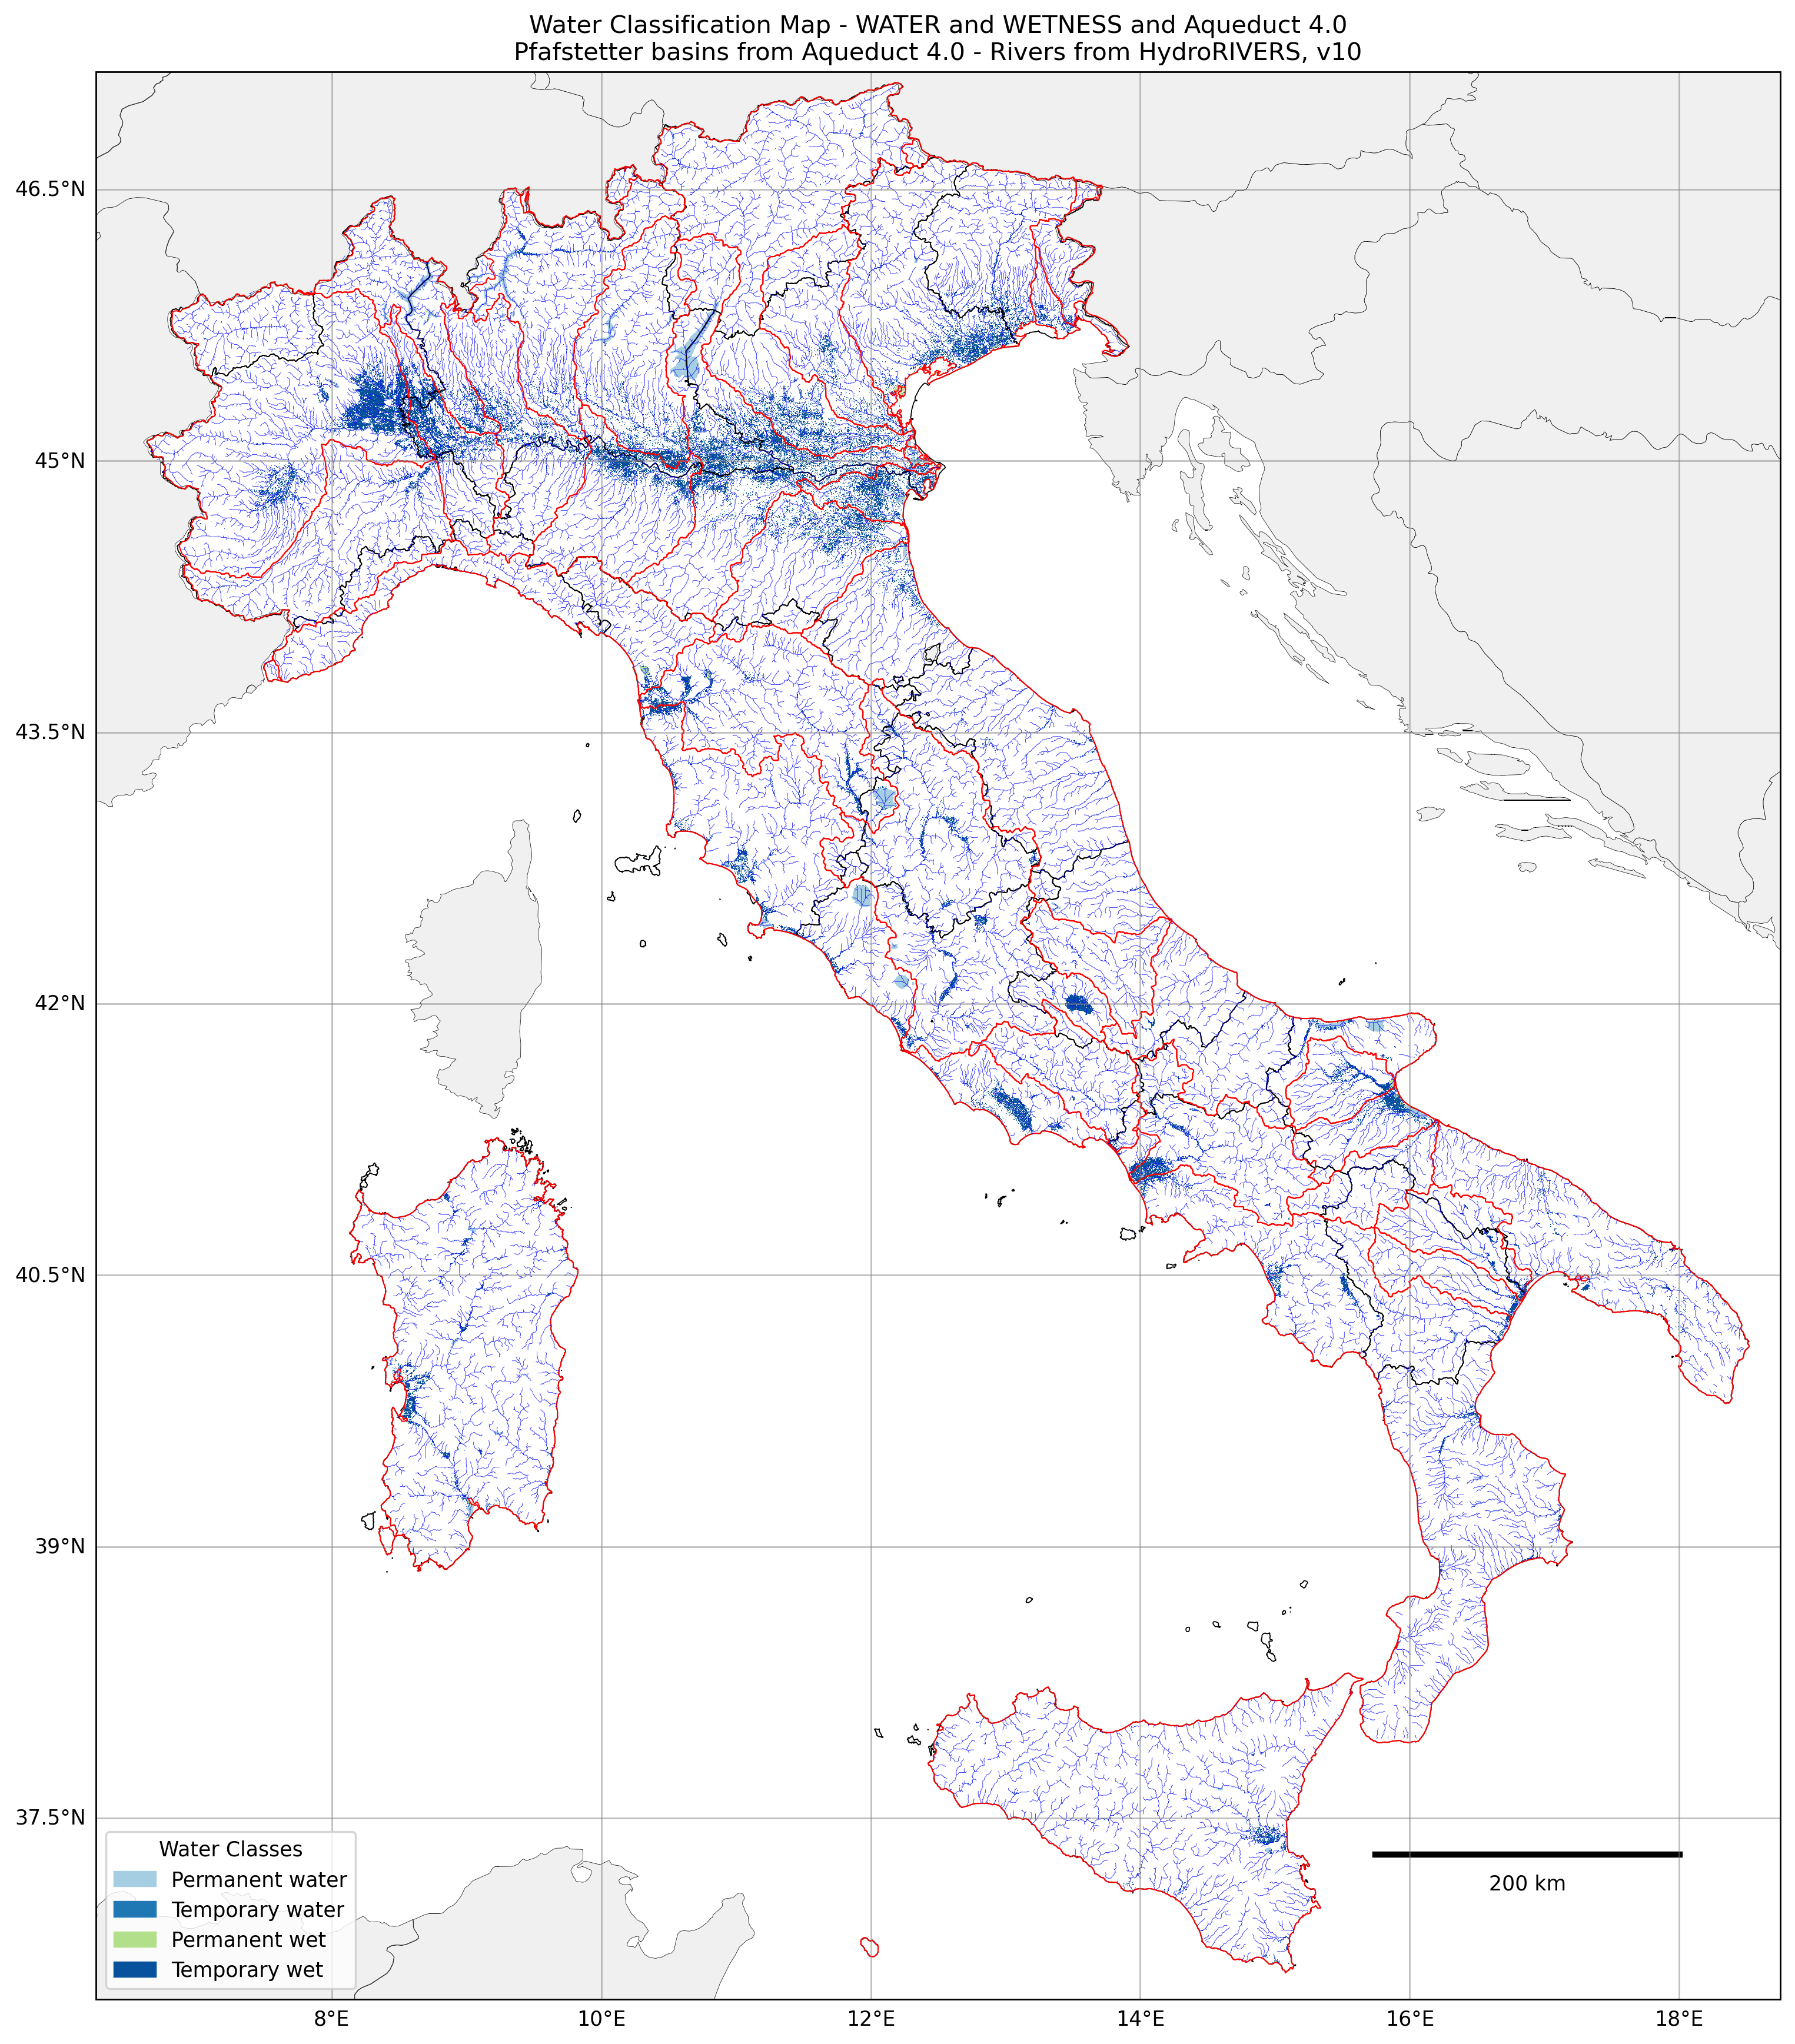
Surface Water Bodies
.png)
.png)
Groundwater Bodies
.png)
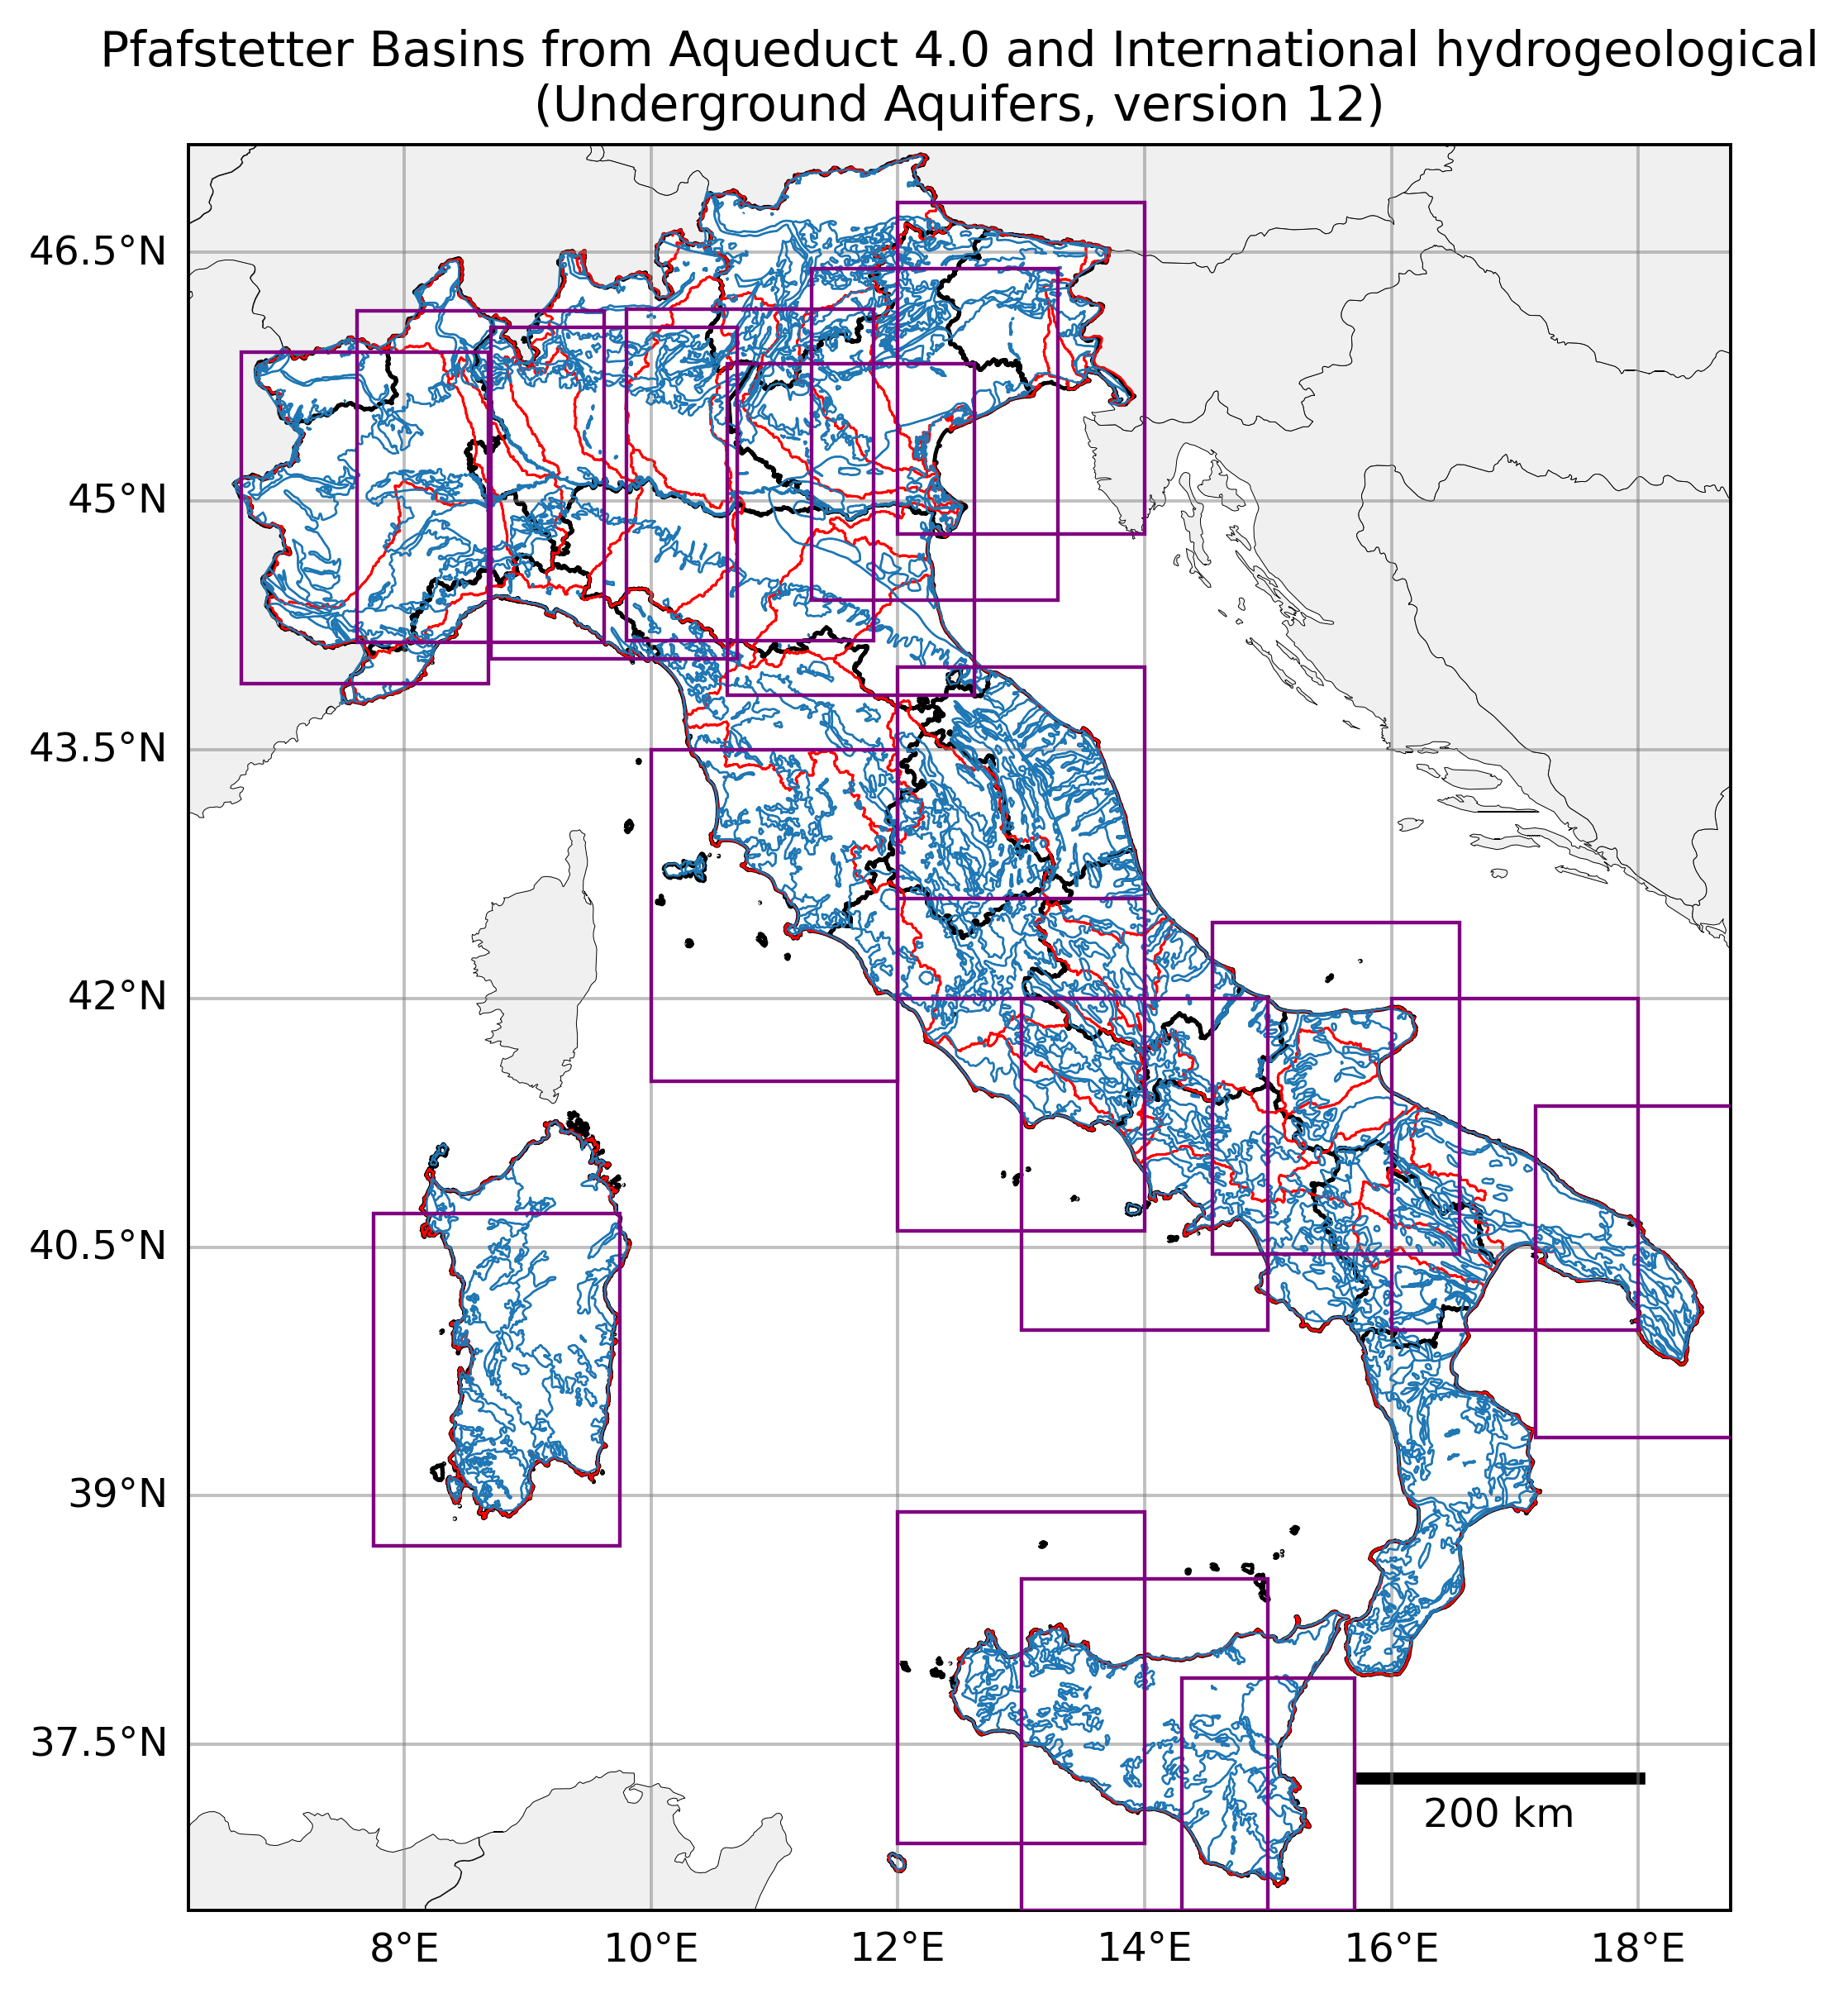
.png)
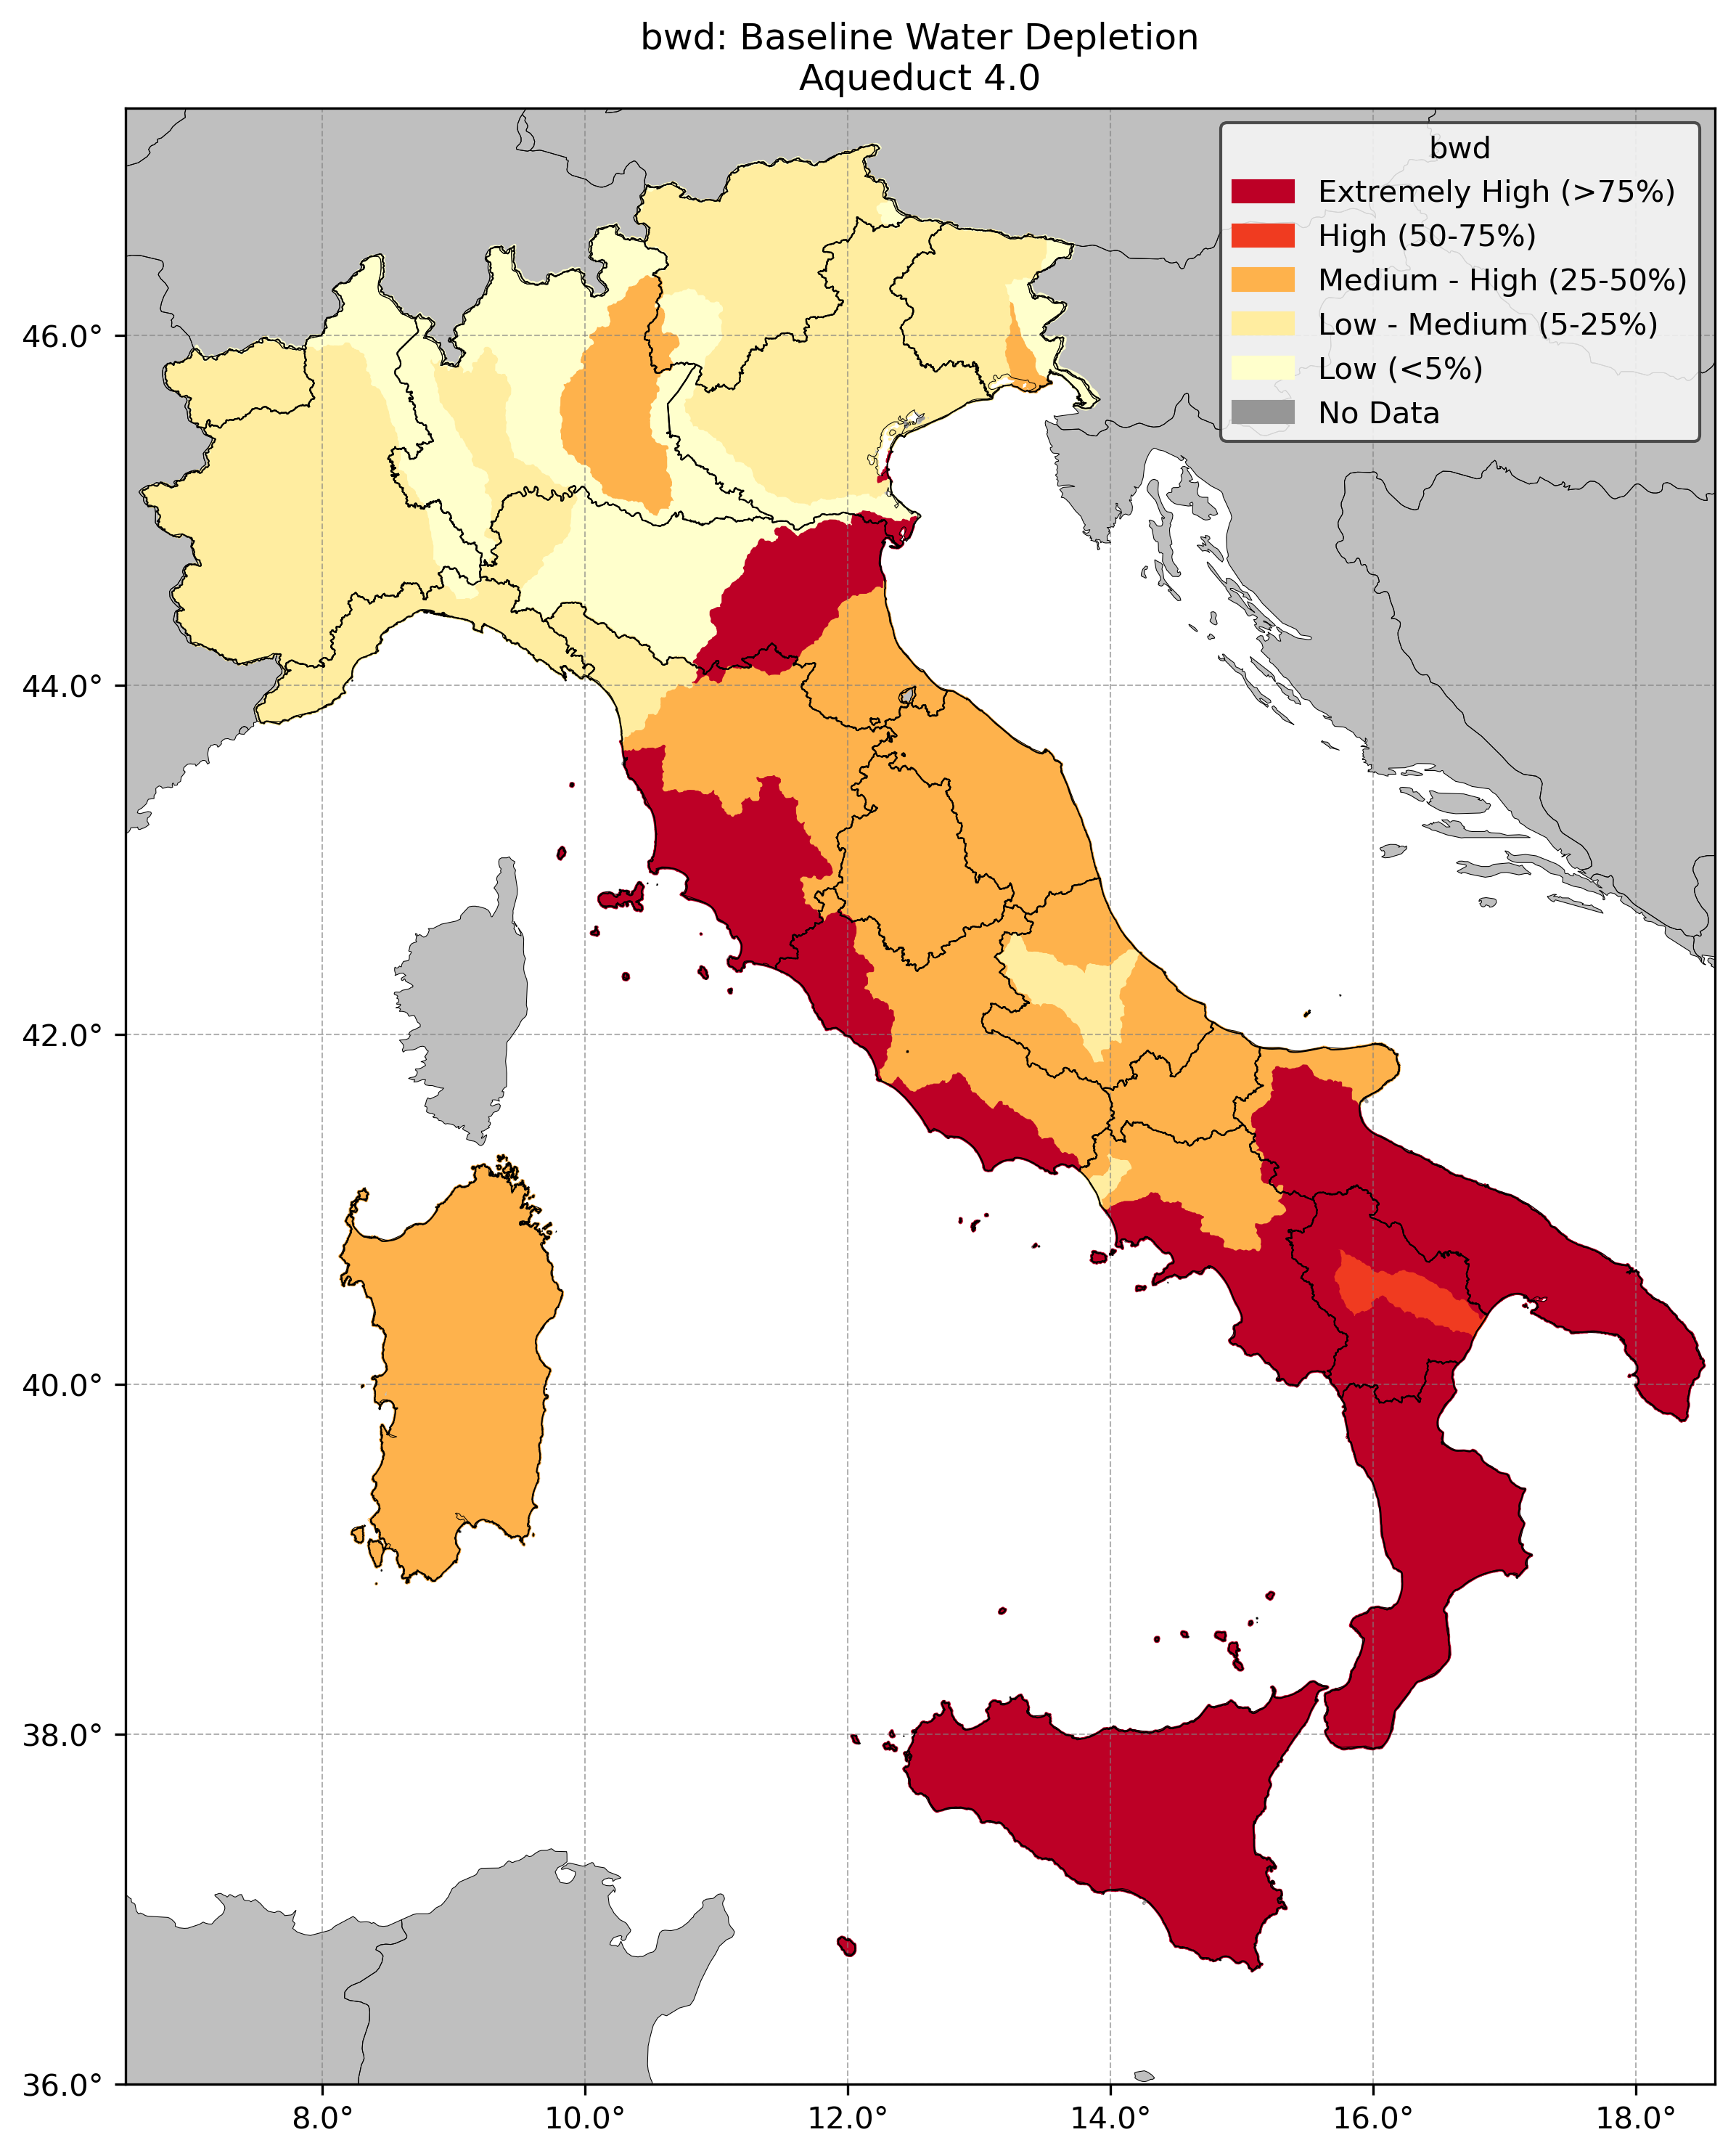
Priority Water Bodies
.png)
.png)
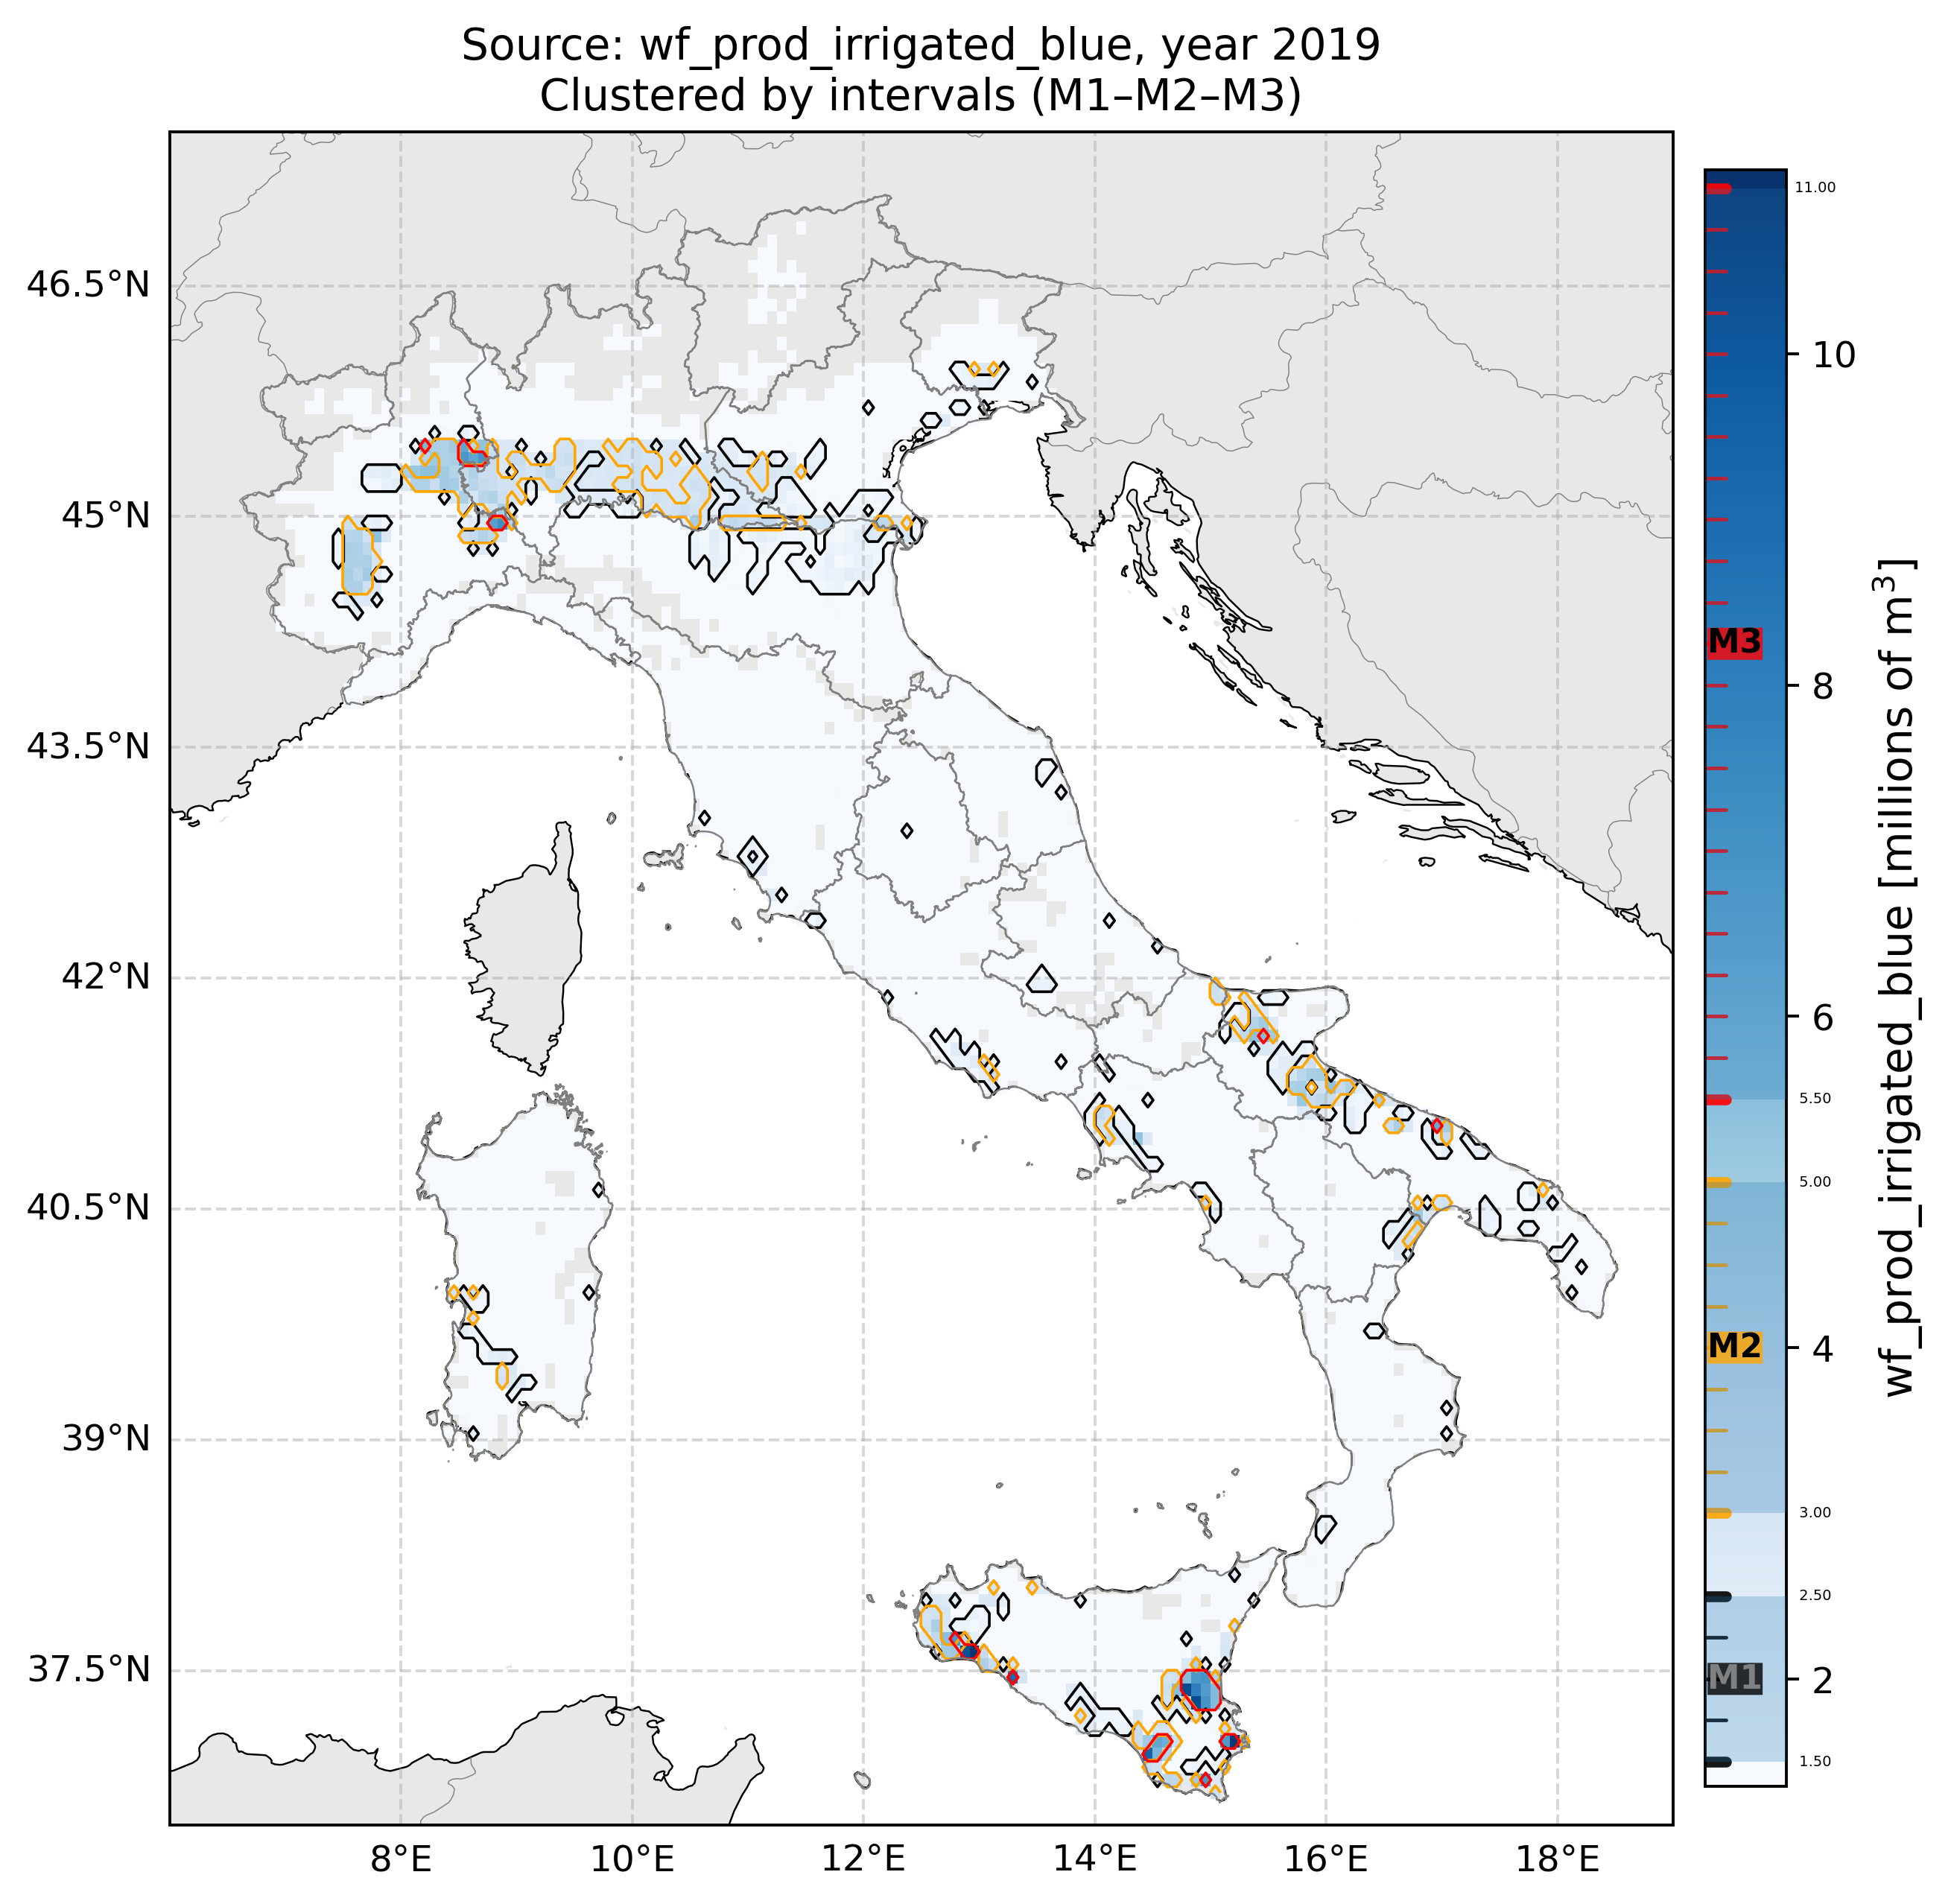
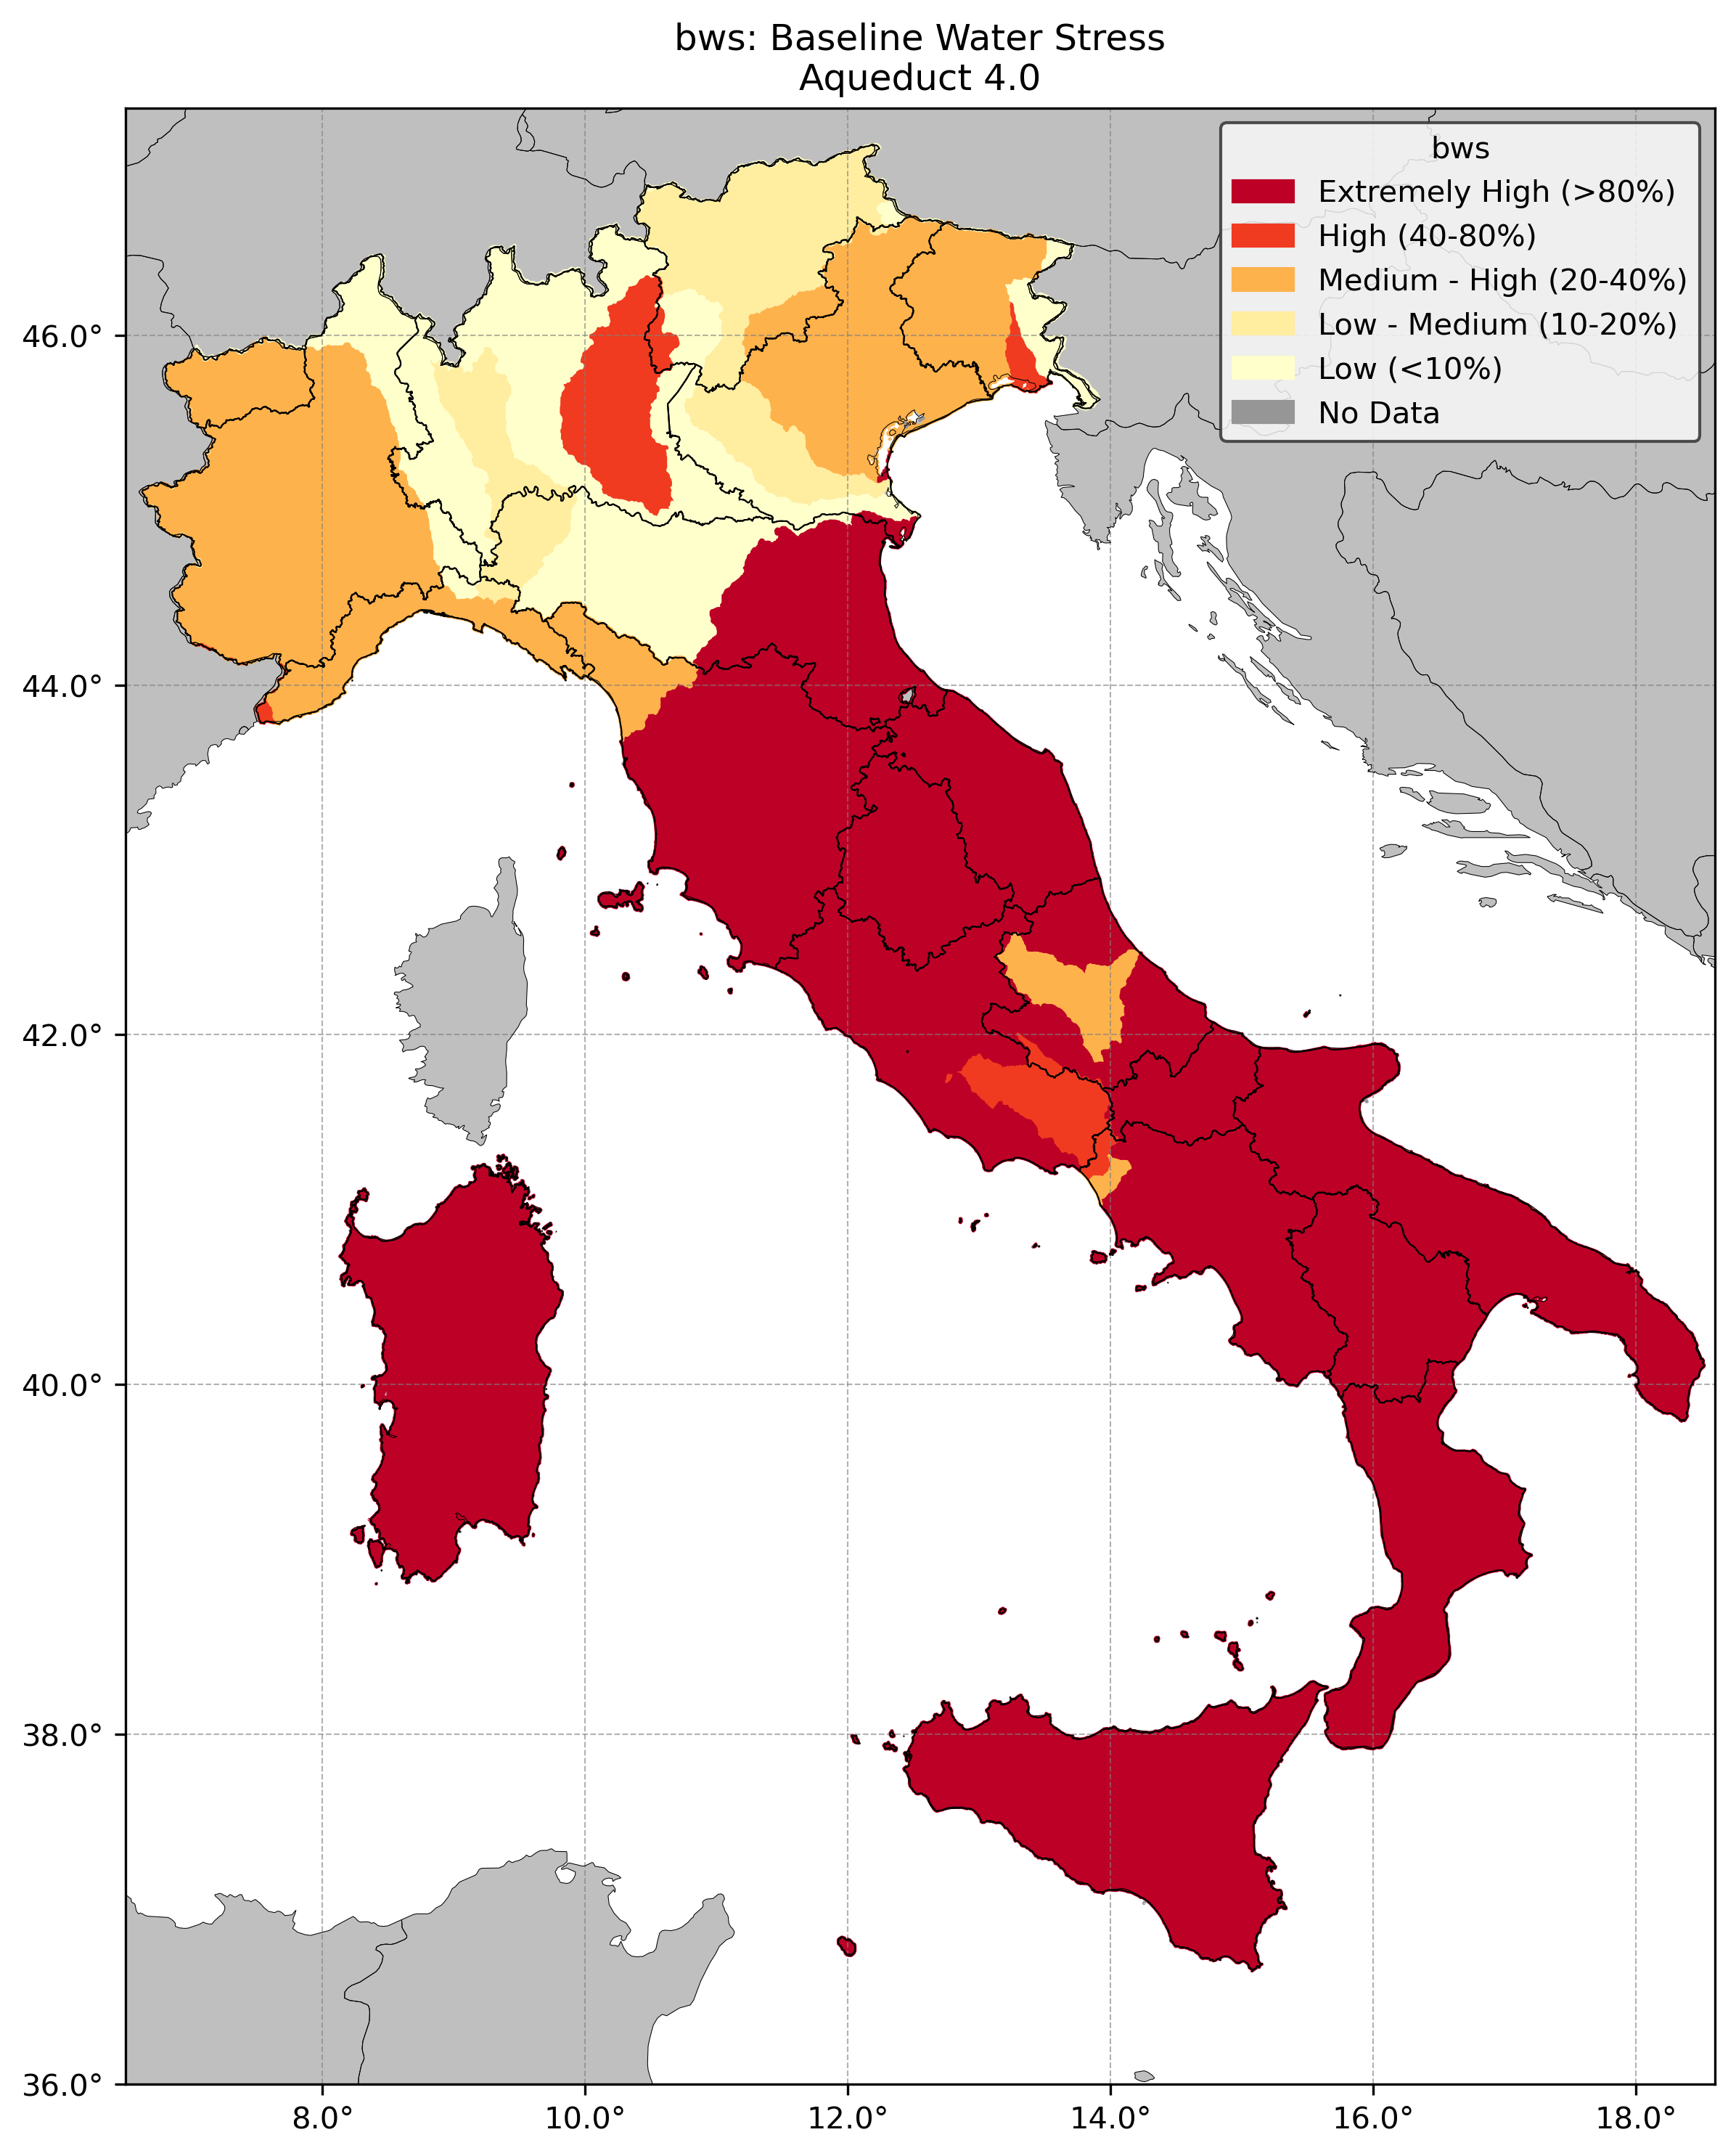
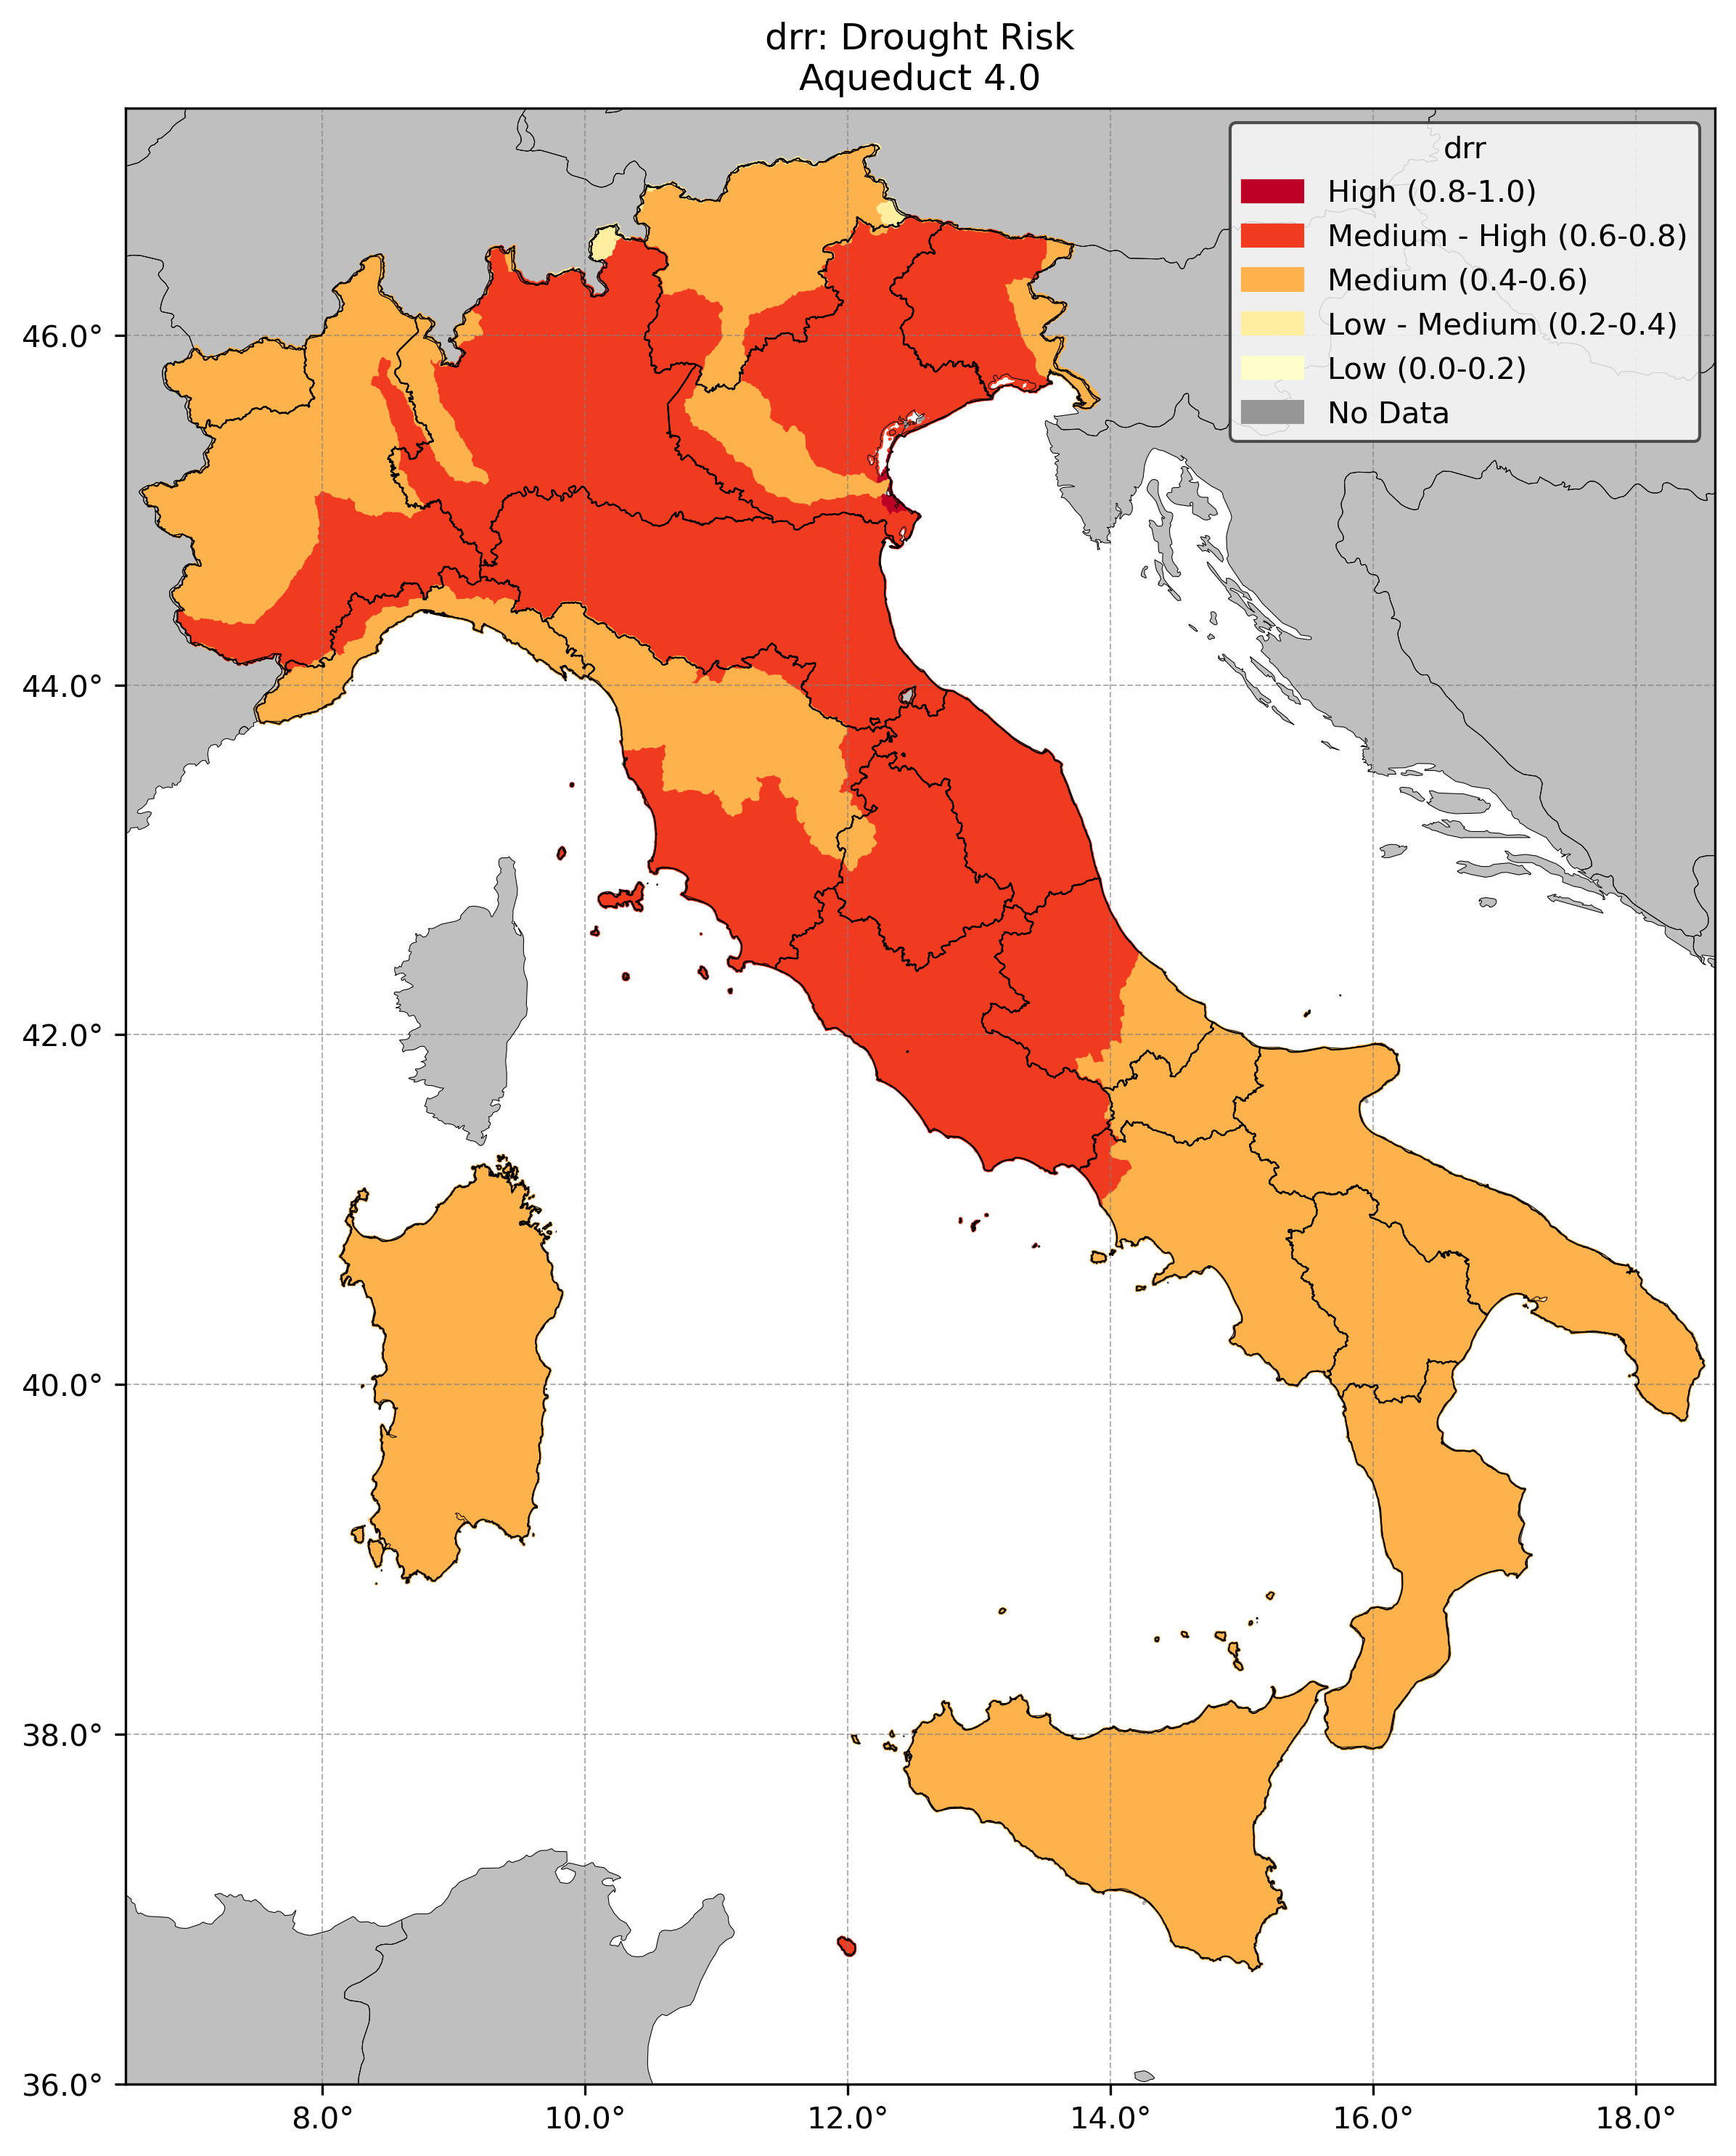
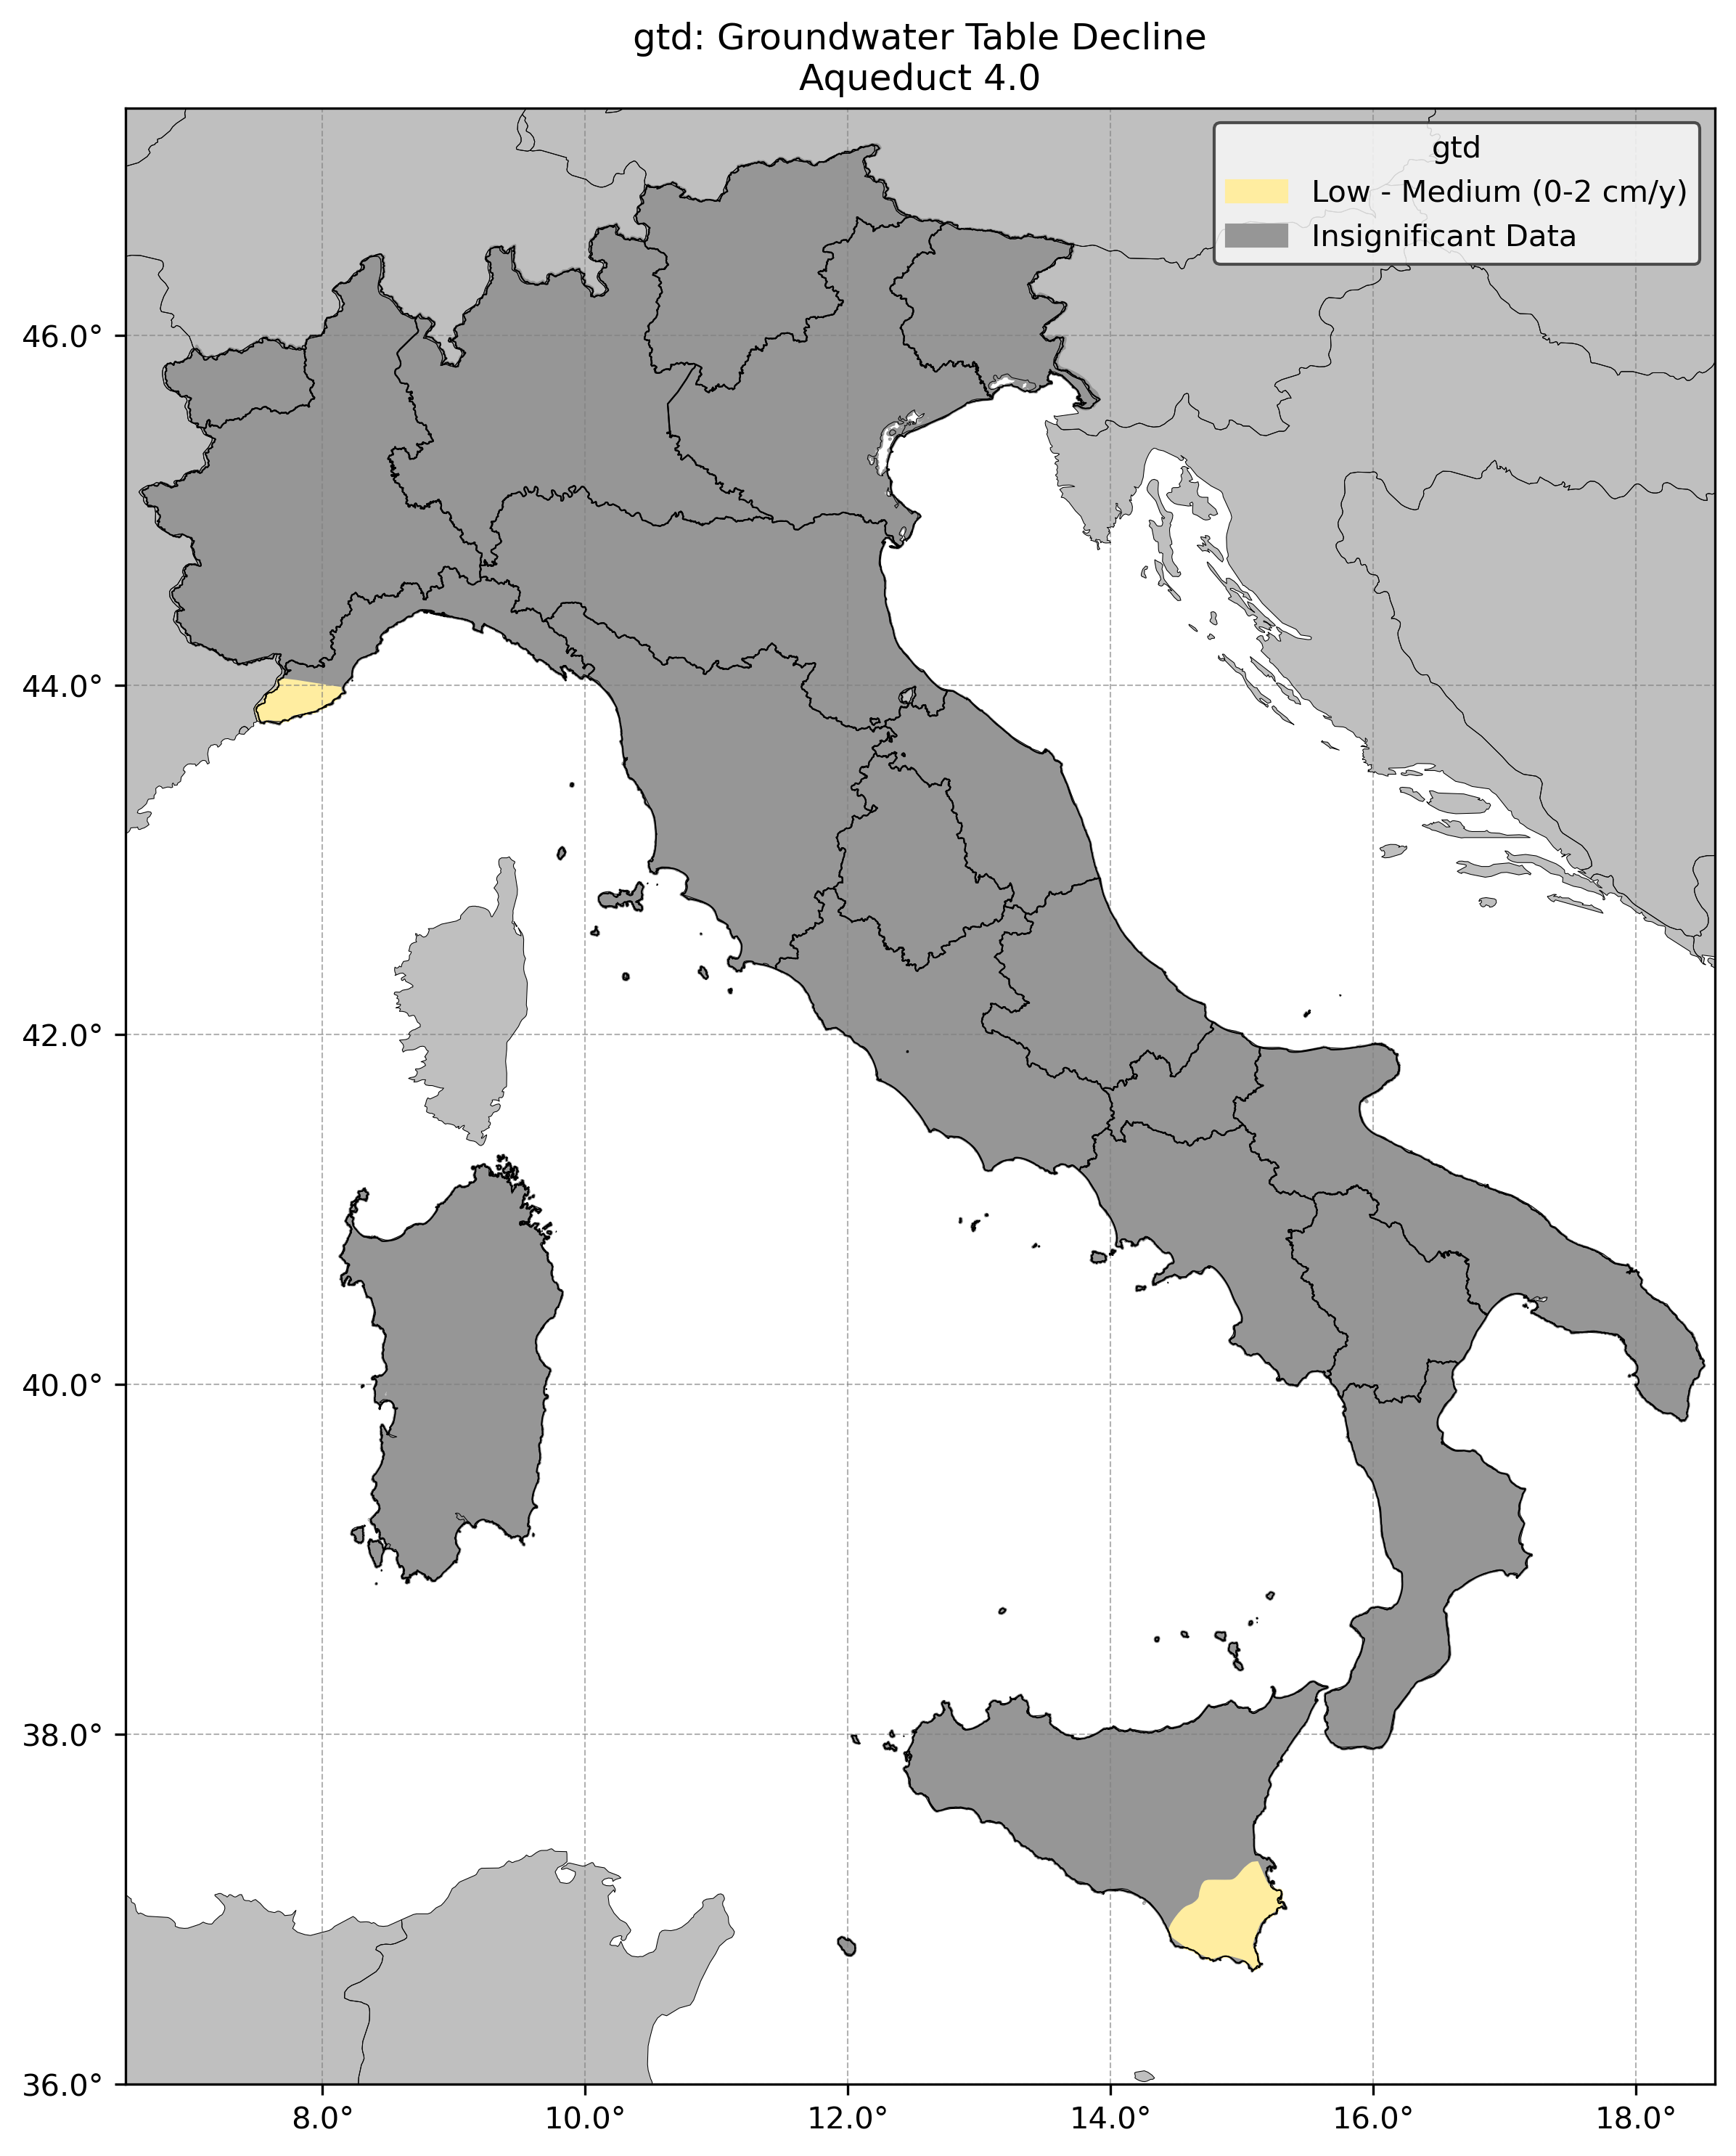
Aqueduct 4.0 Indicators 2D for Italy
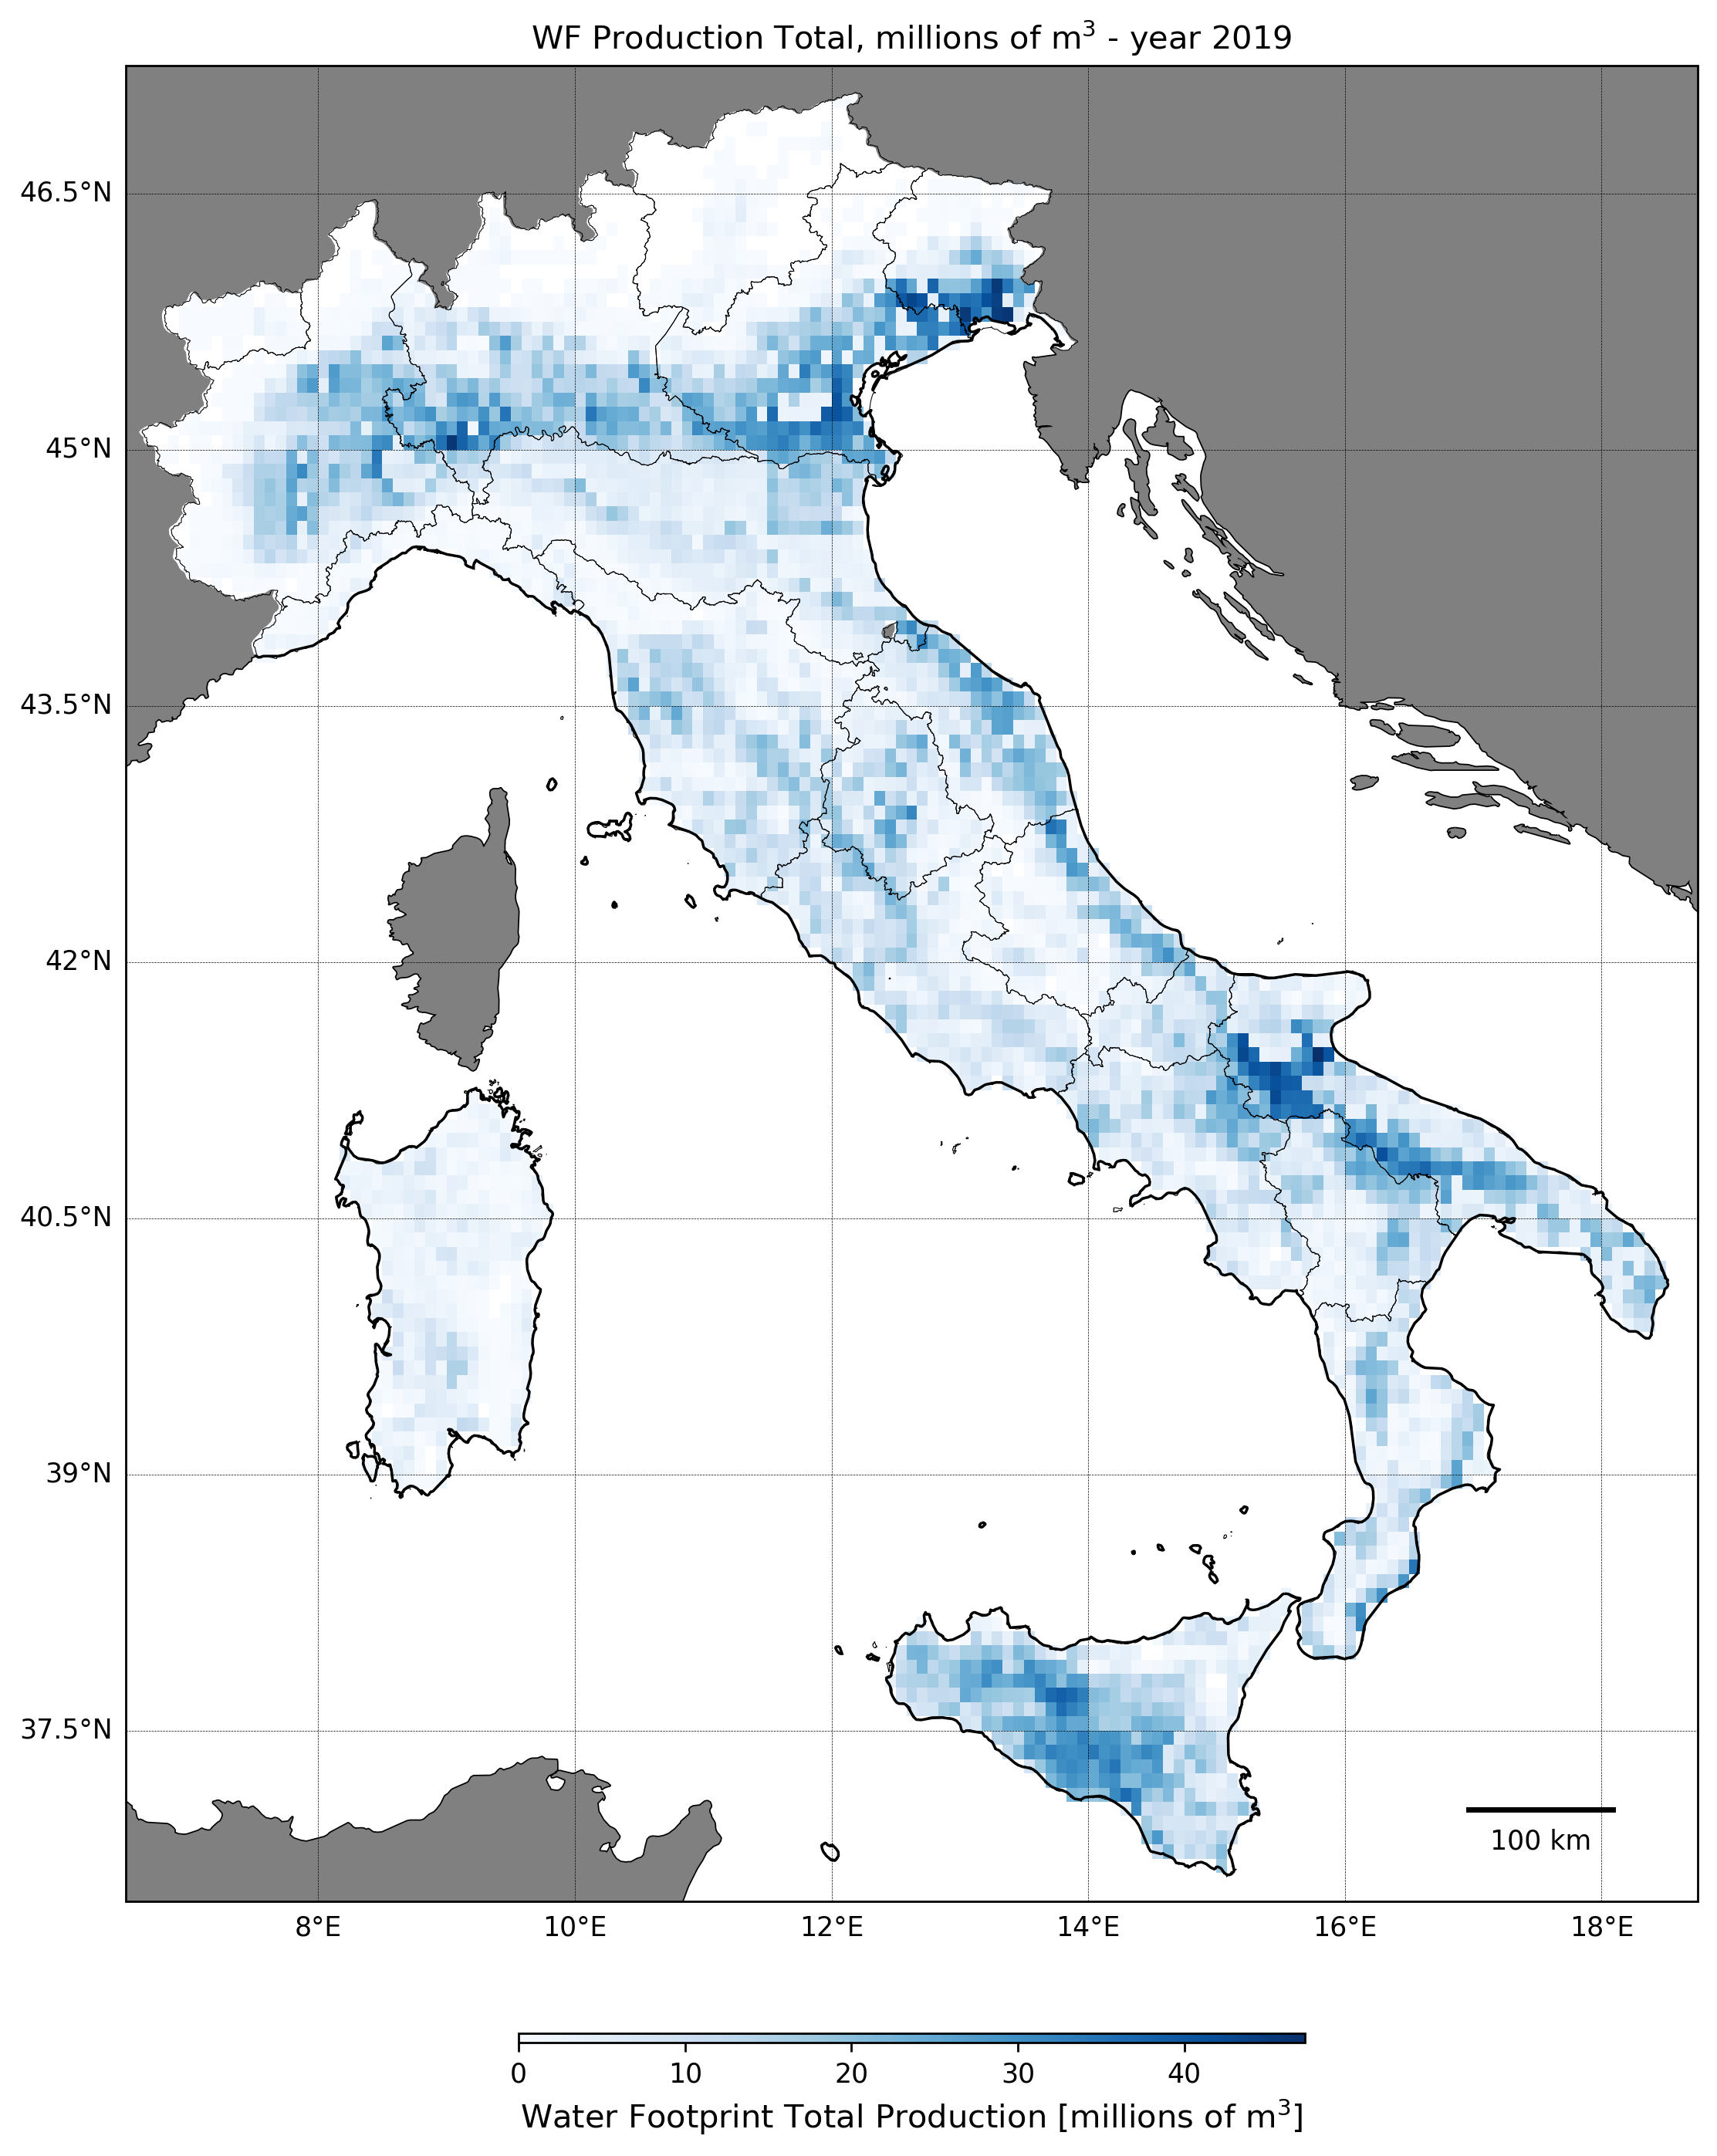
National Total Water Footprint of Production for Italy
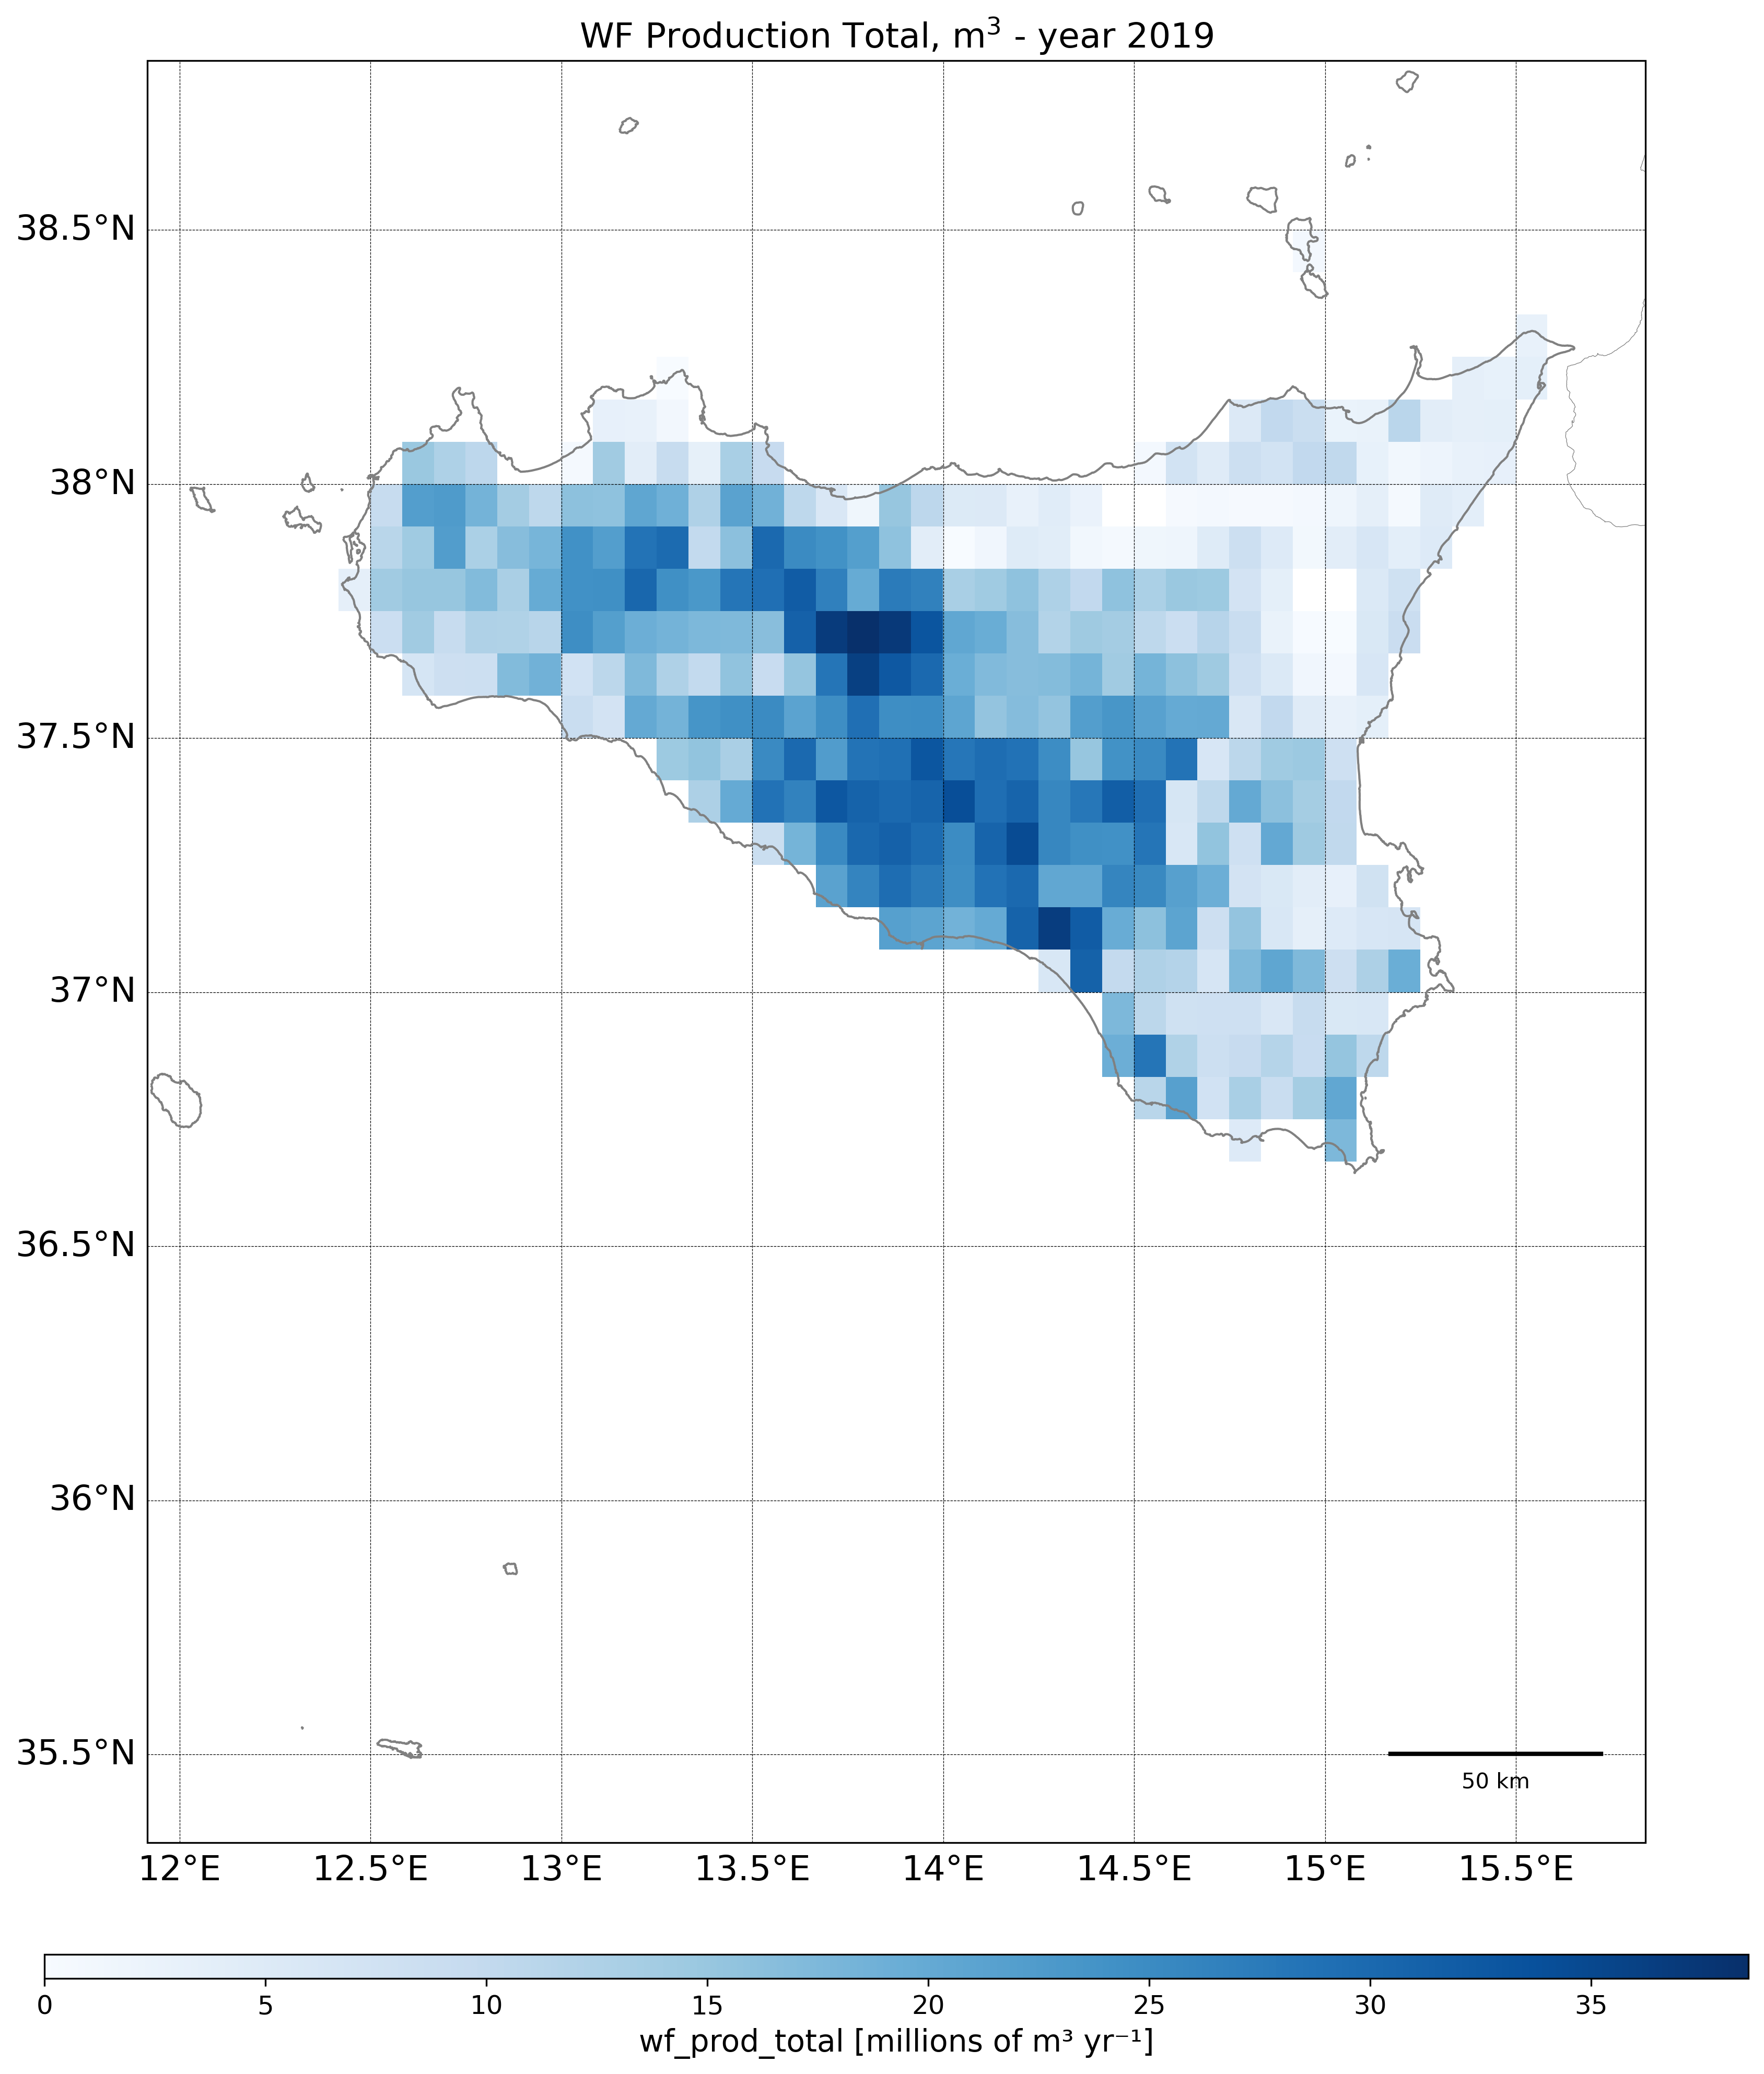
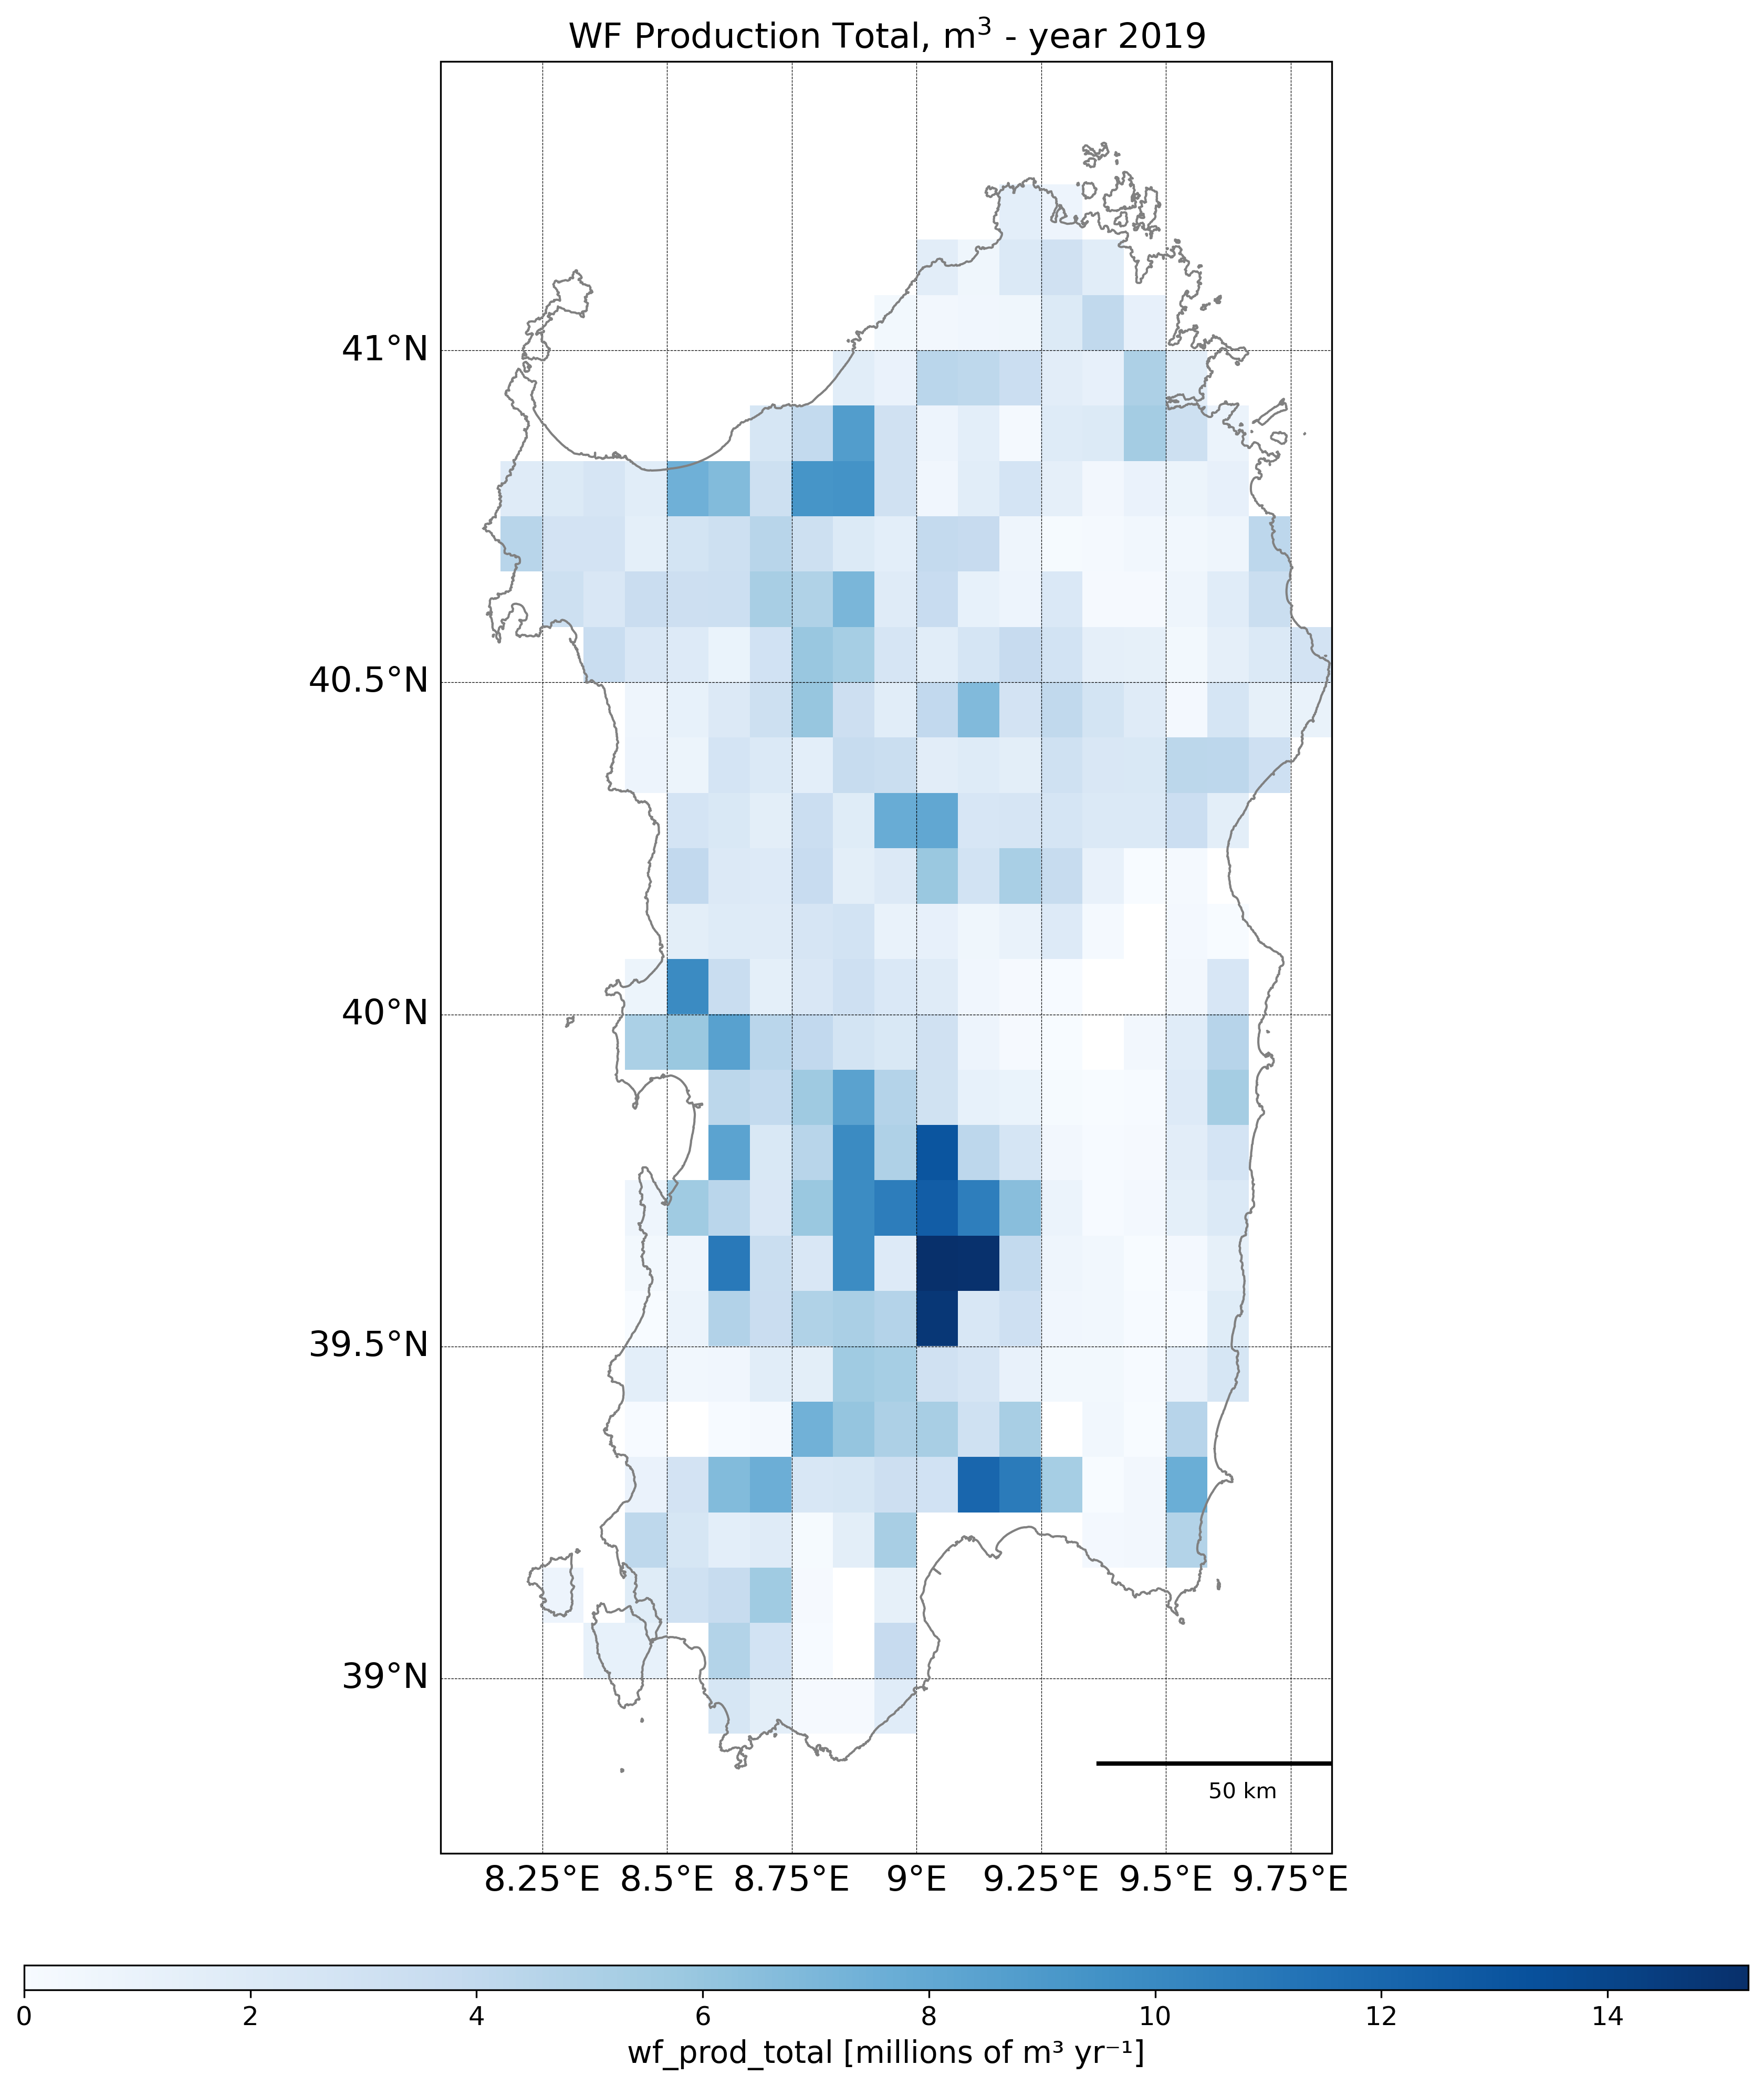
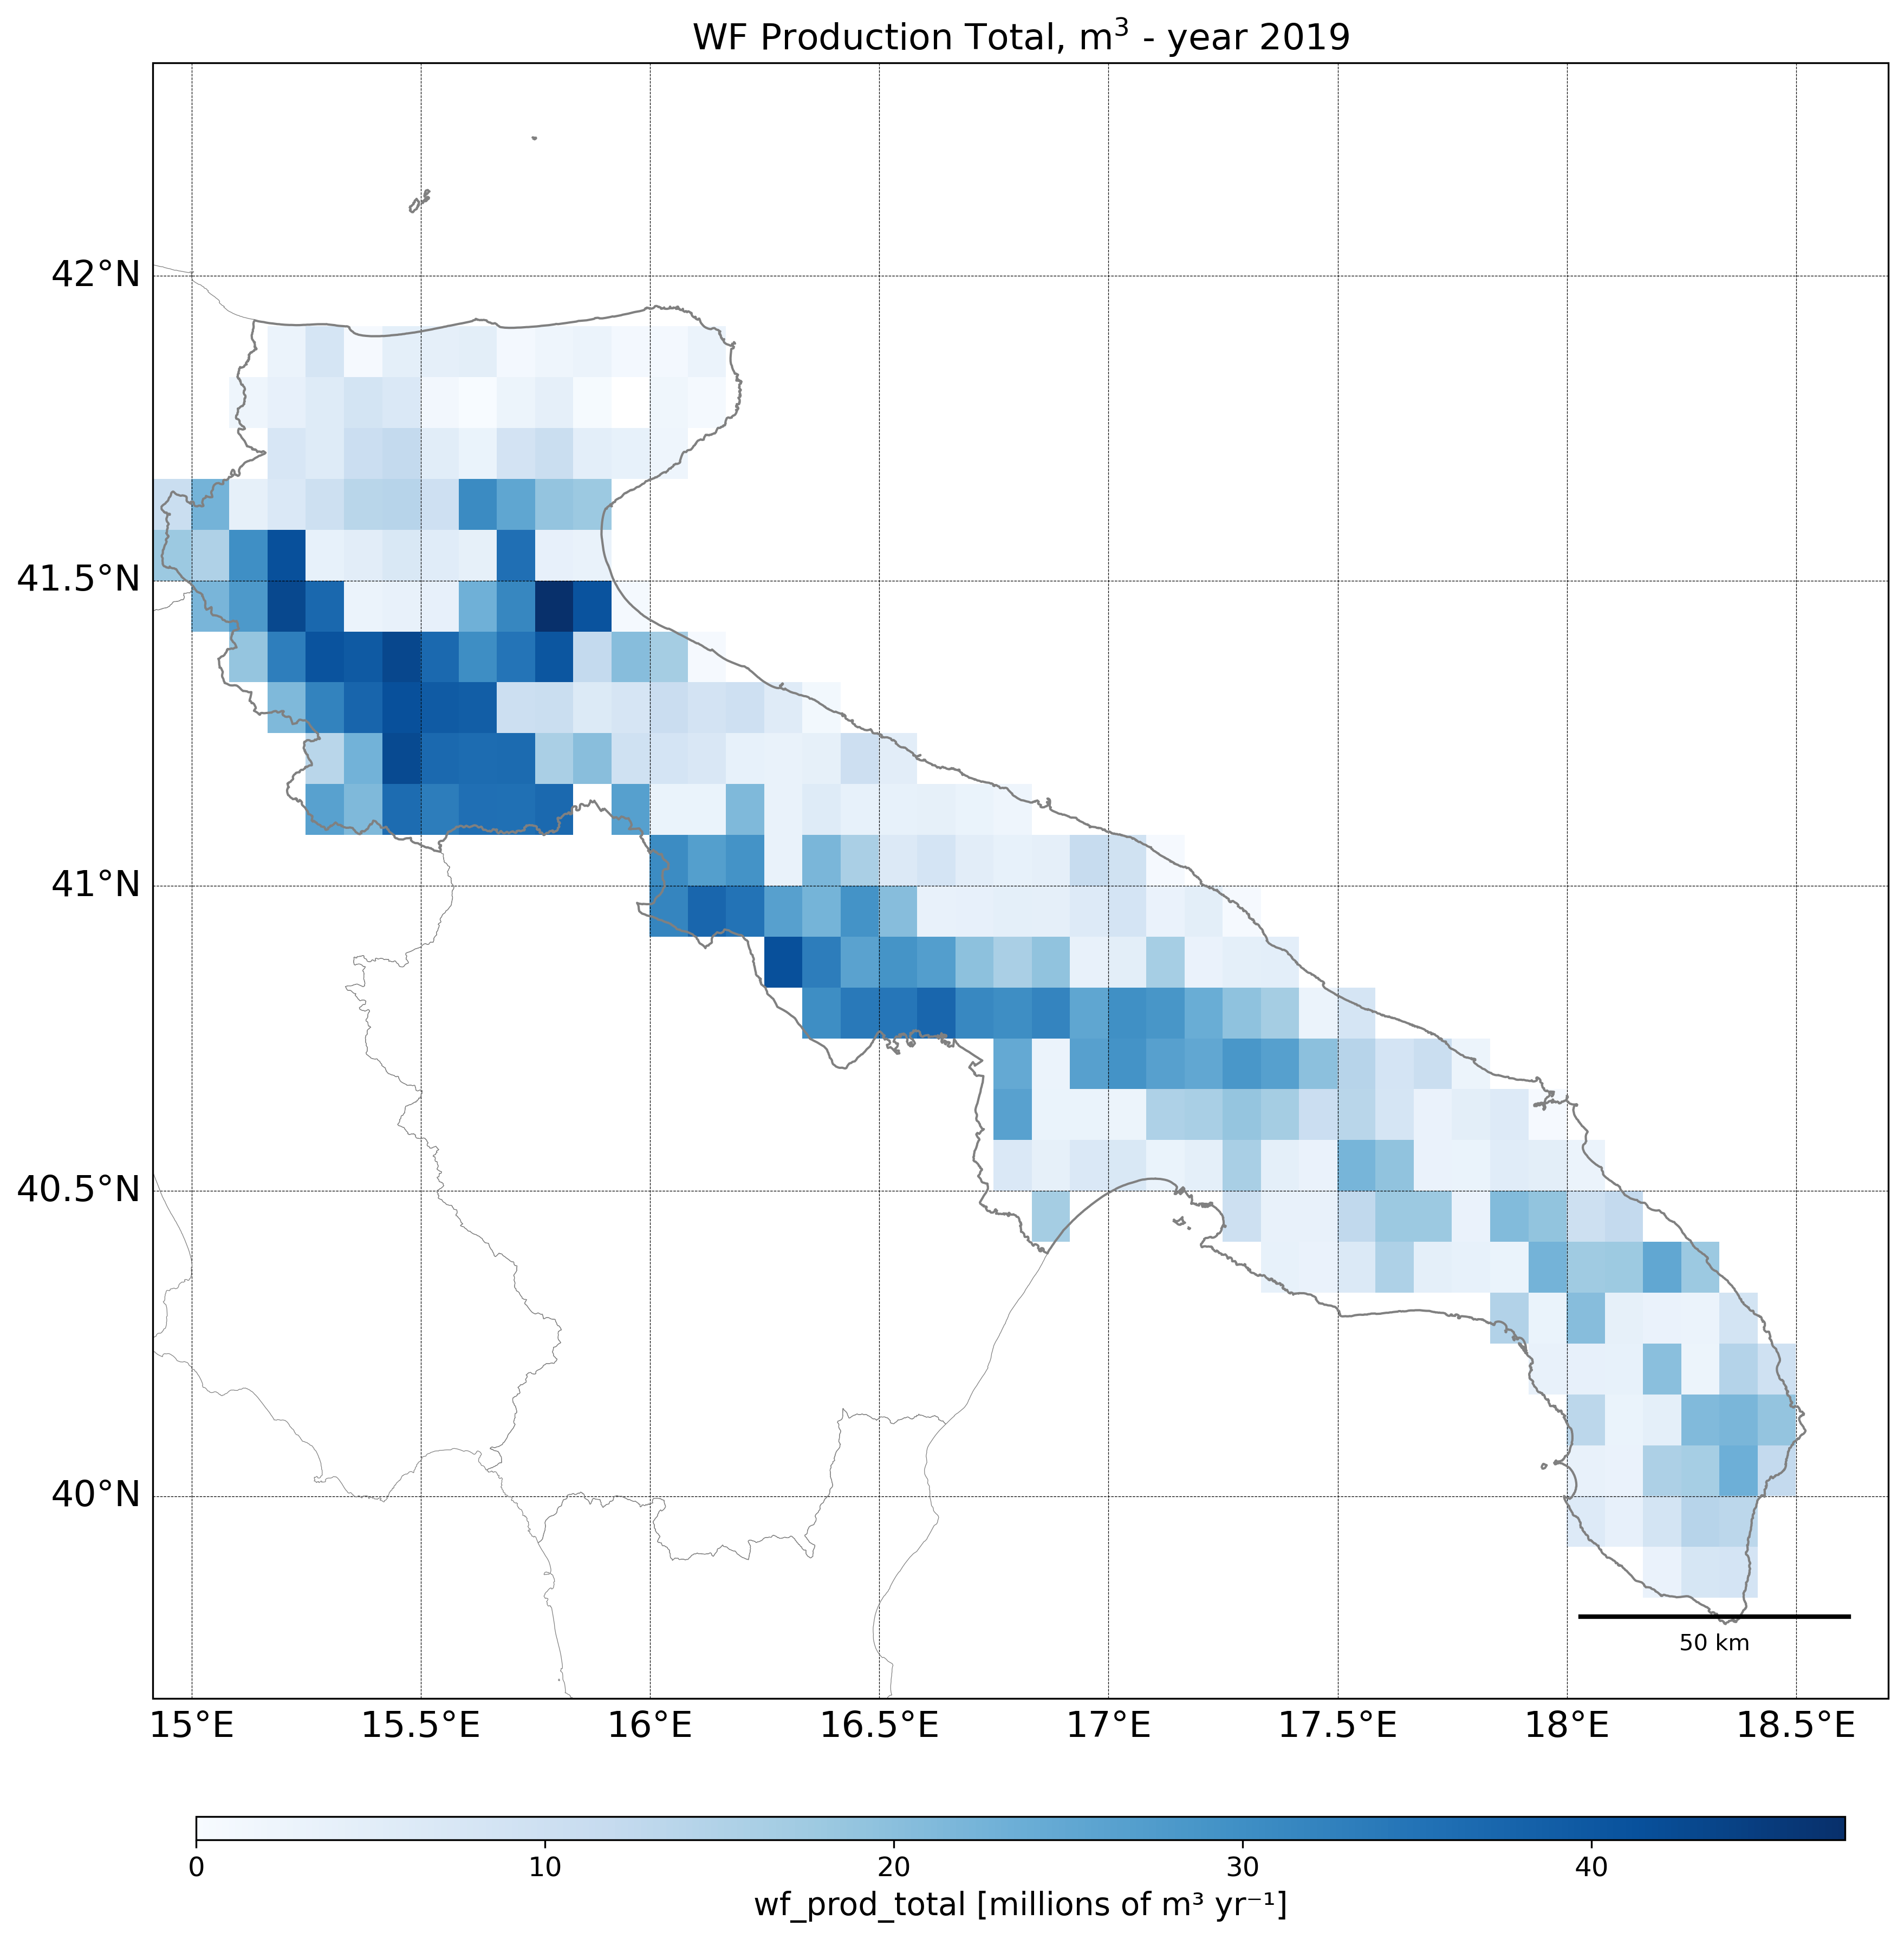
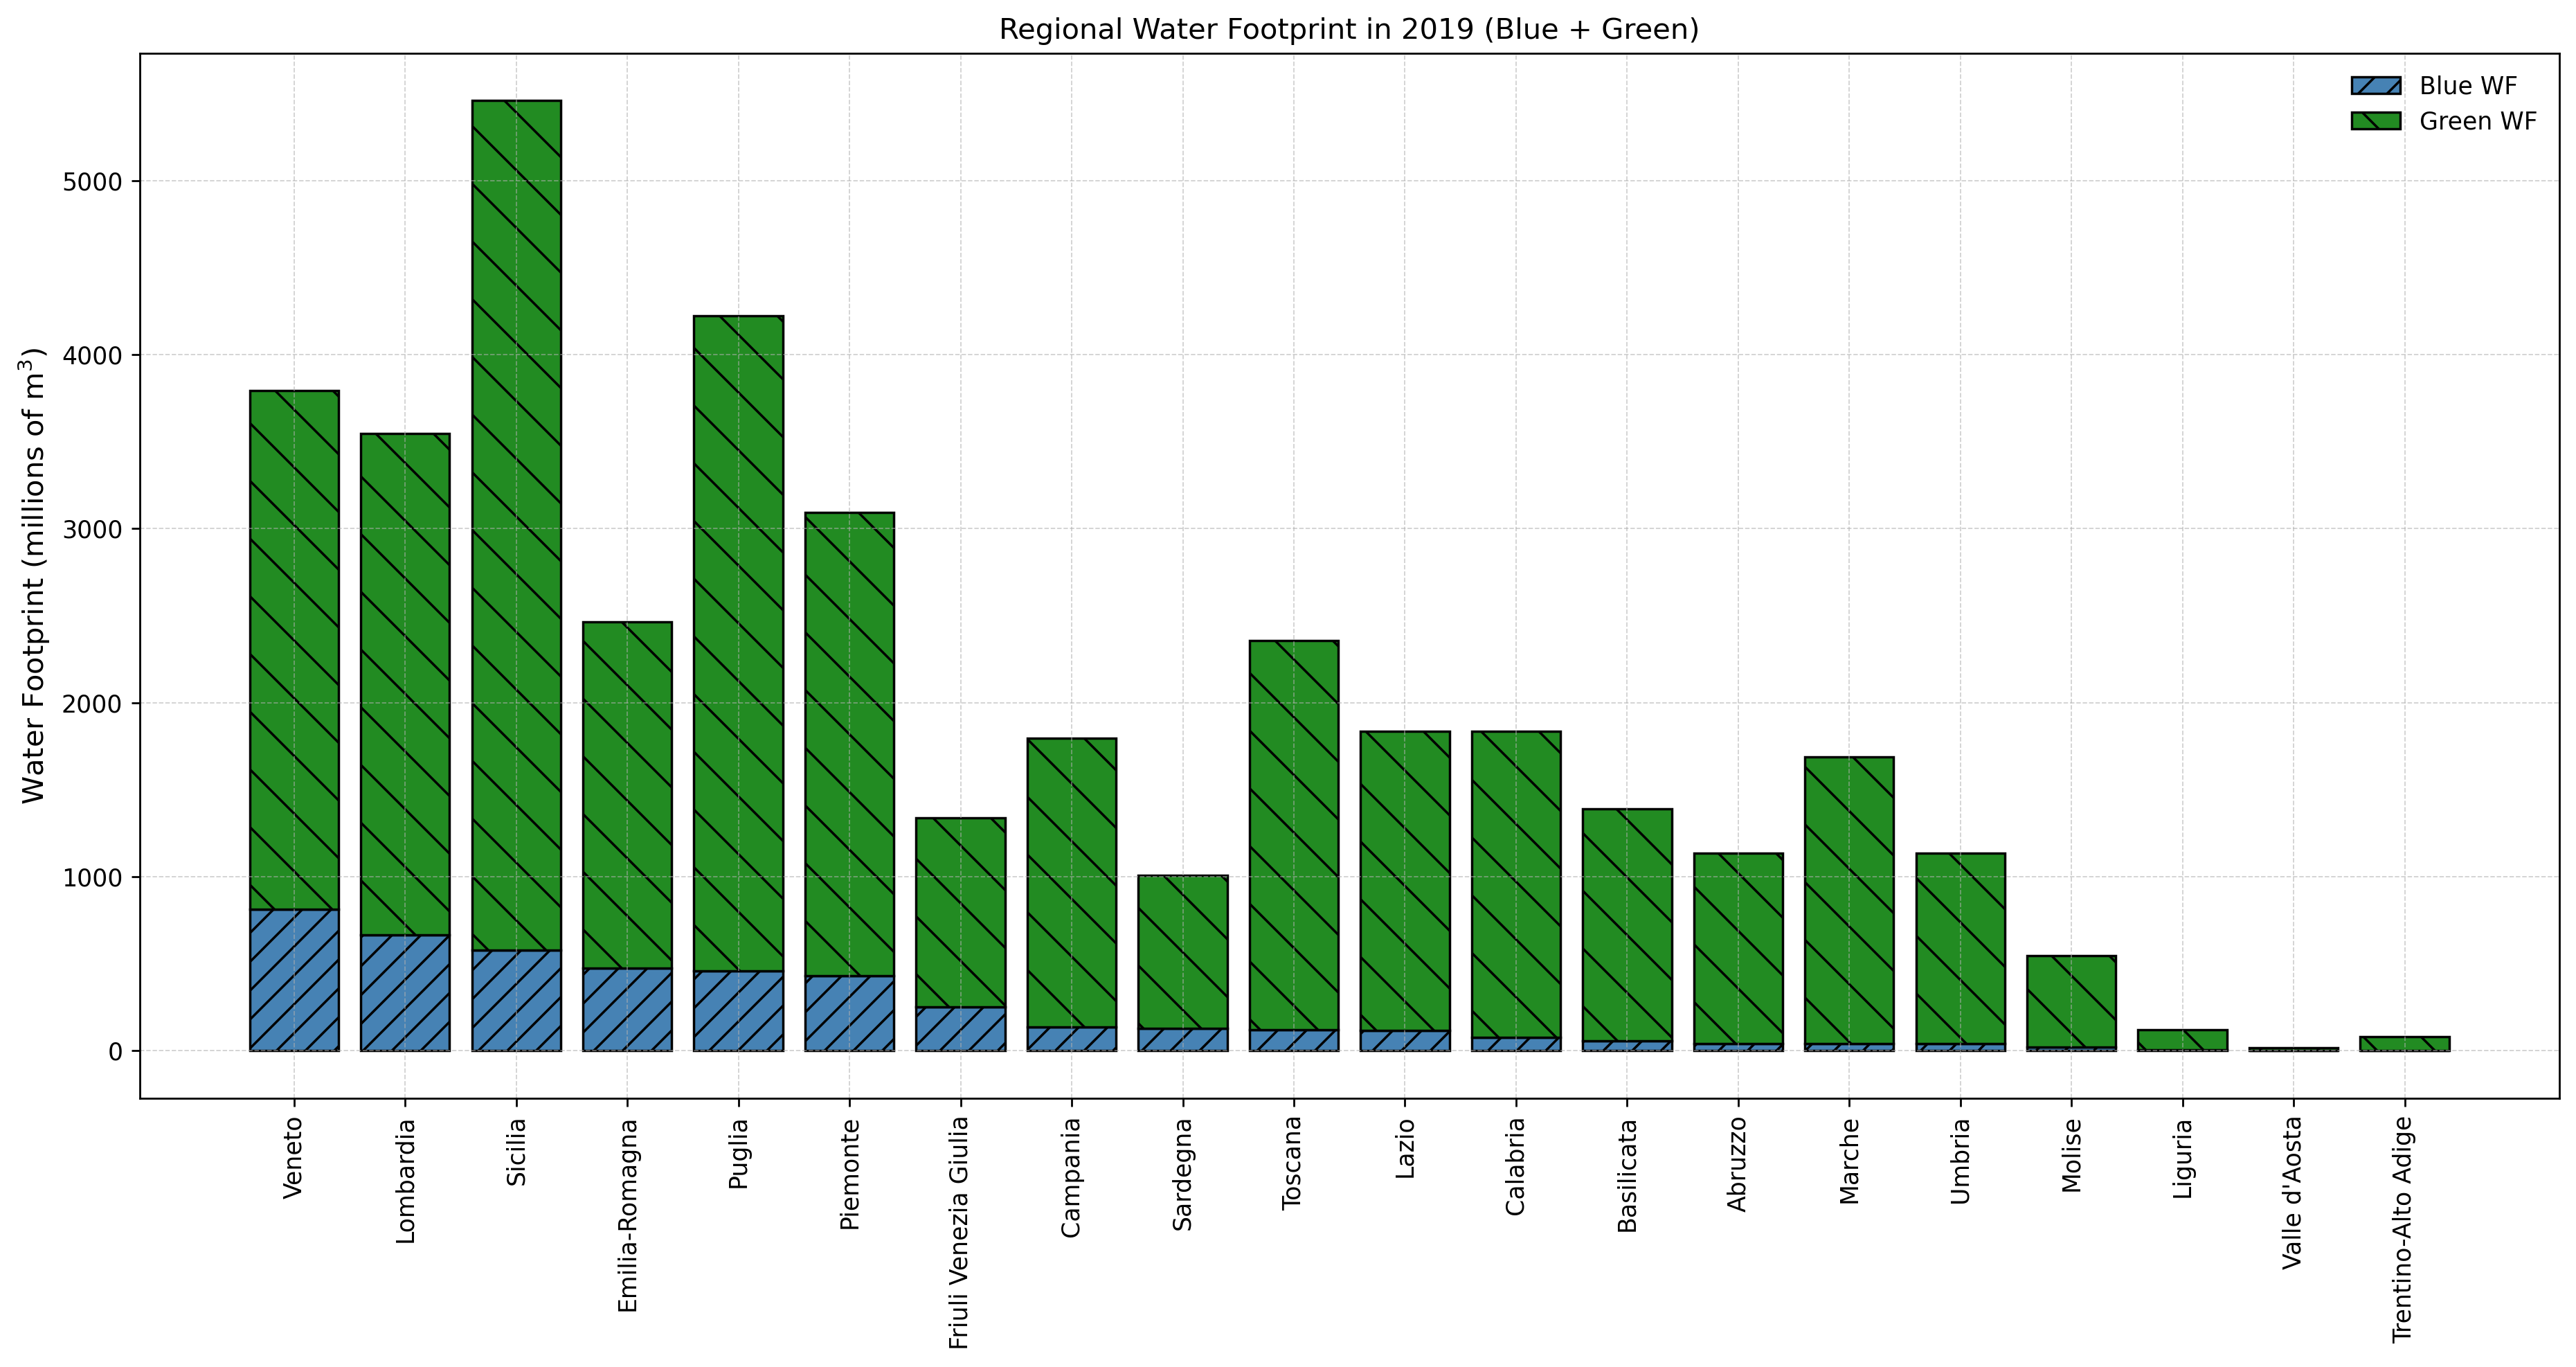
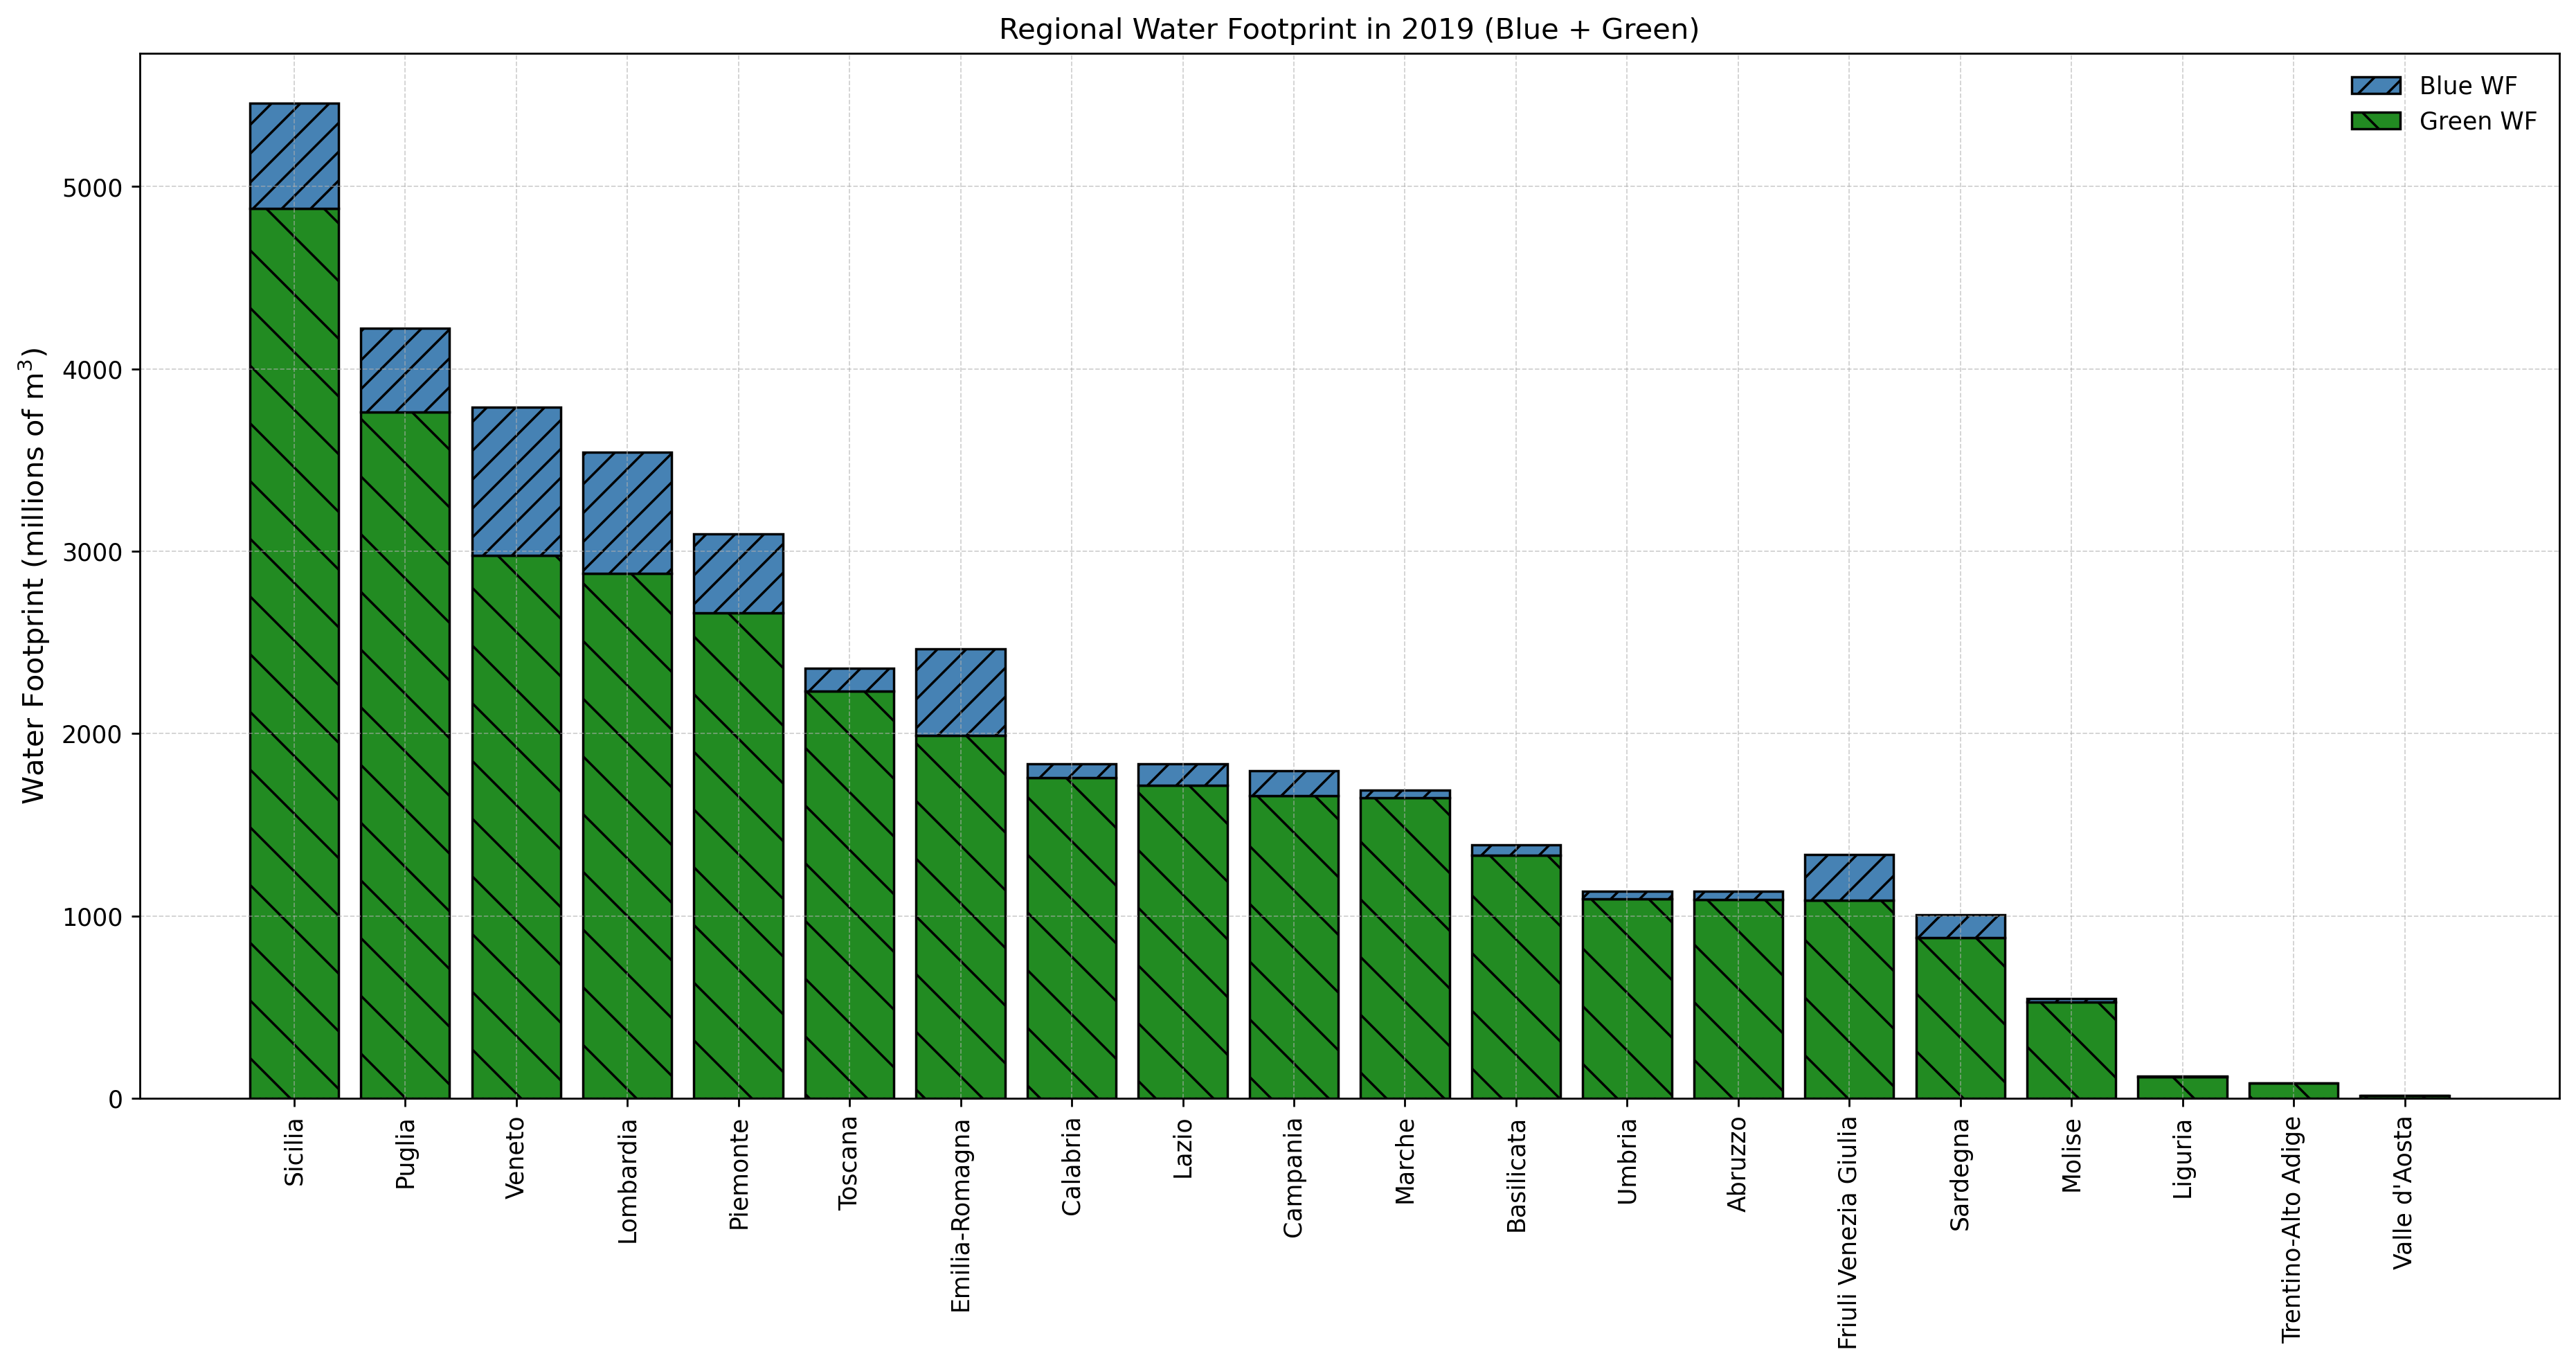
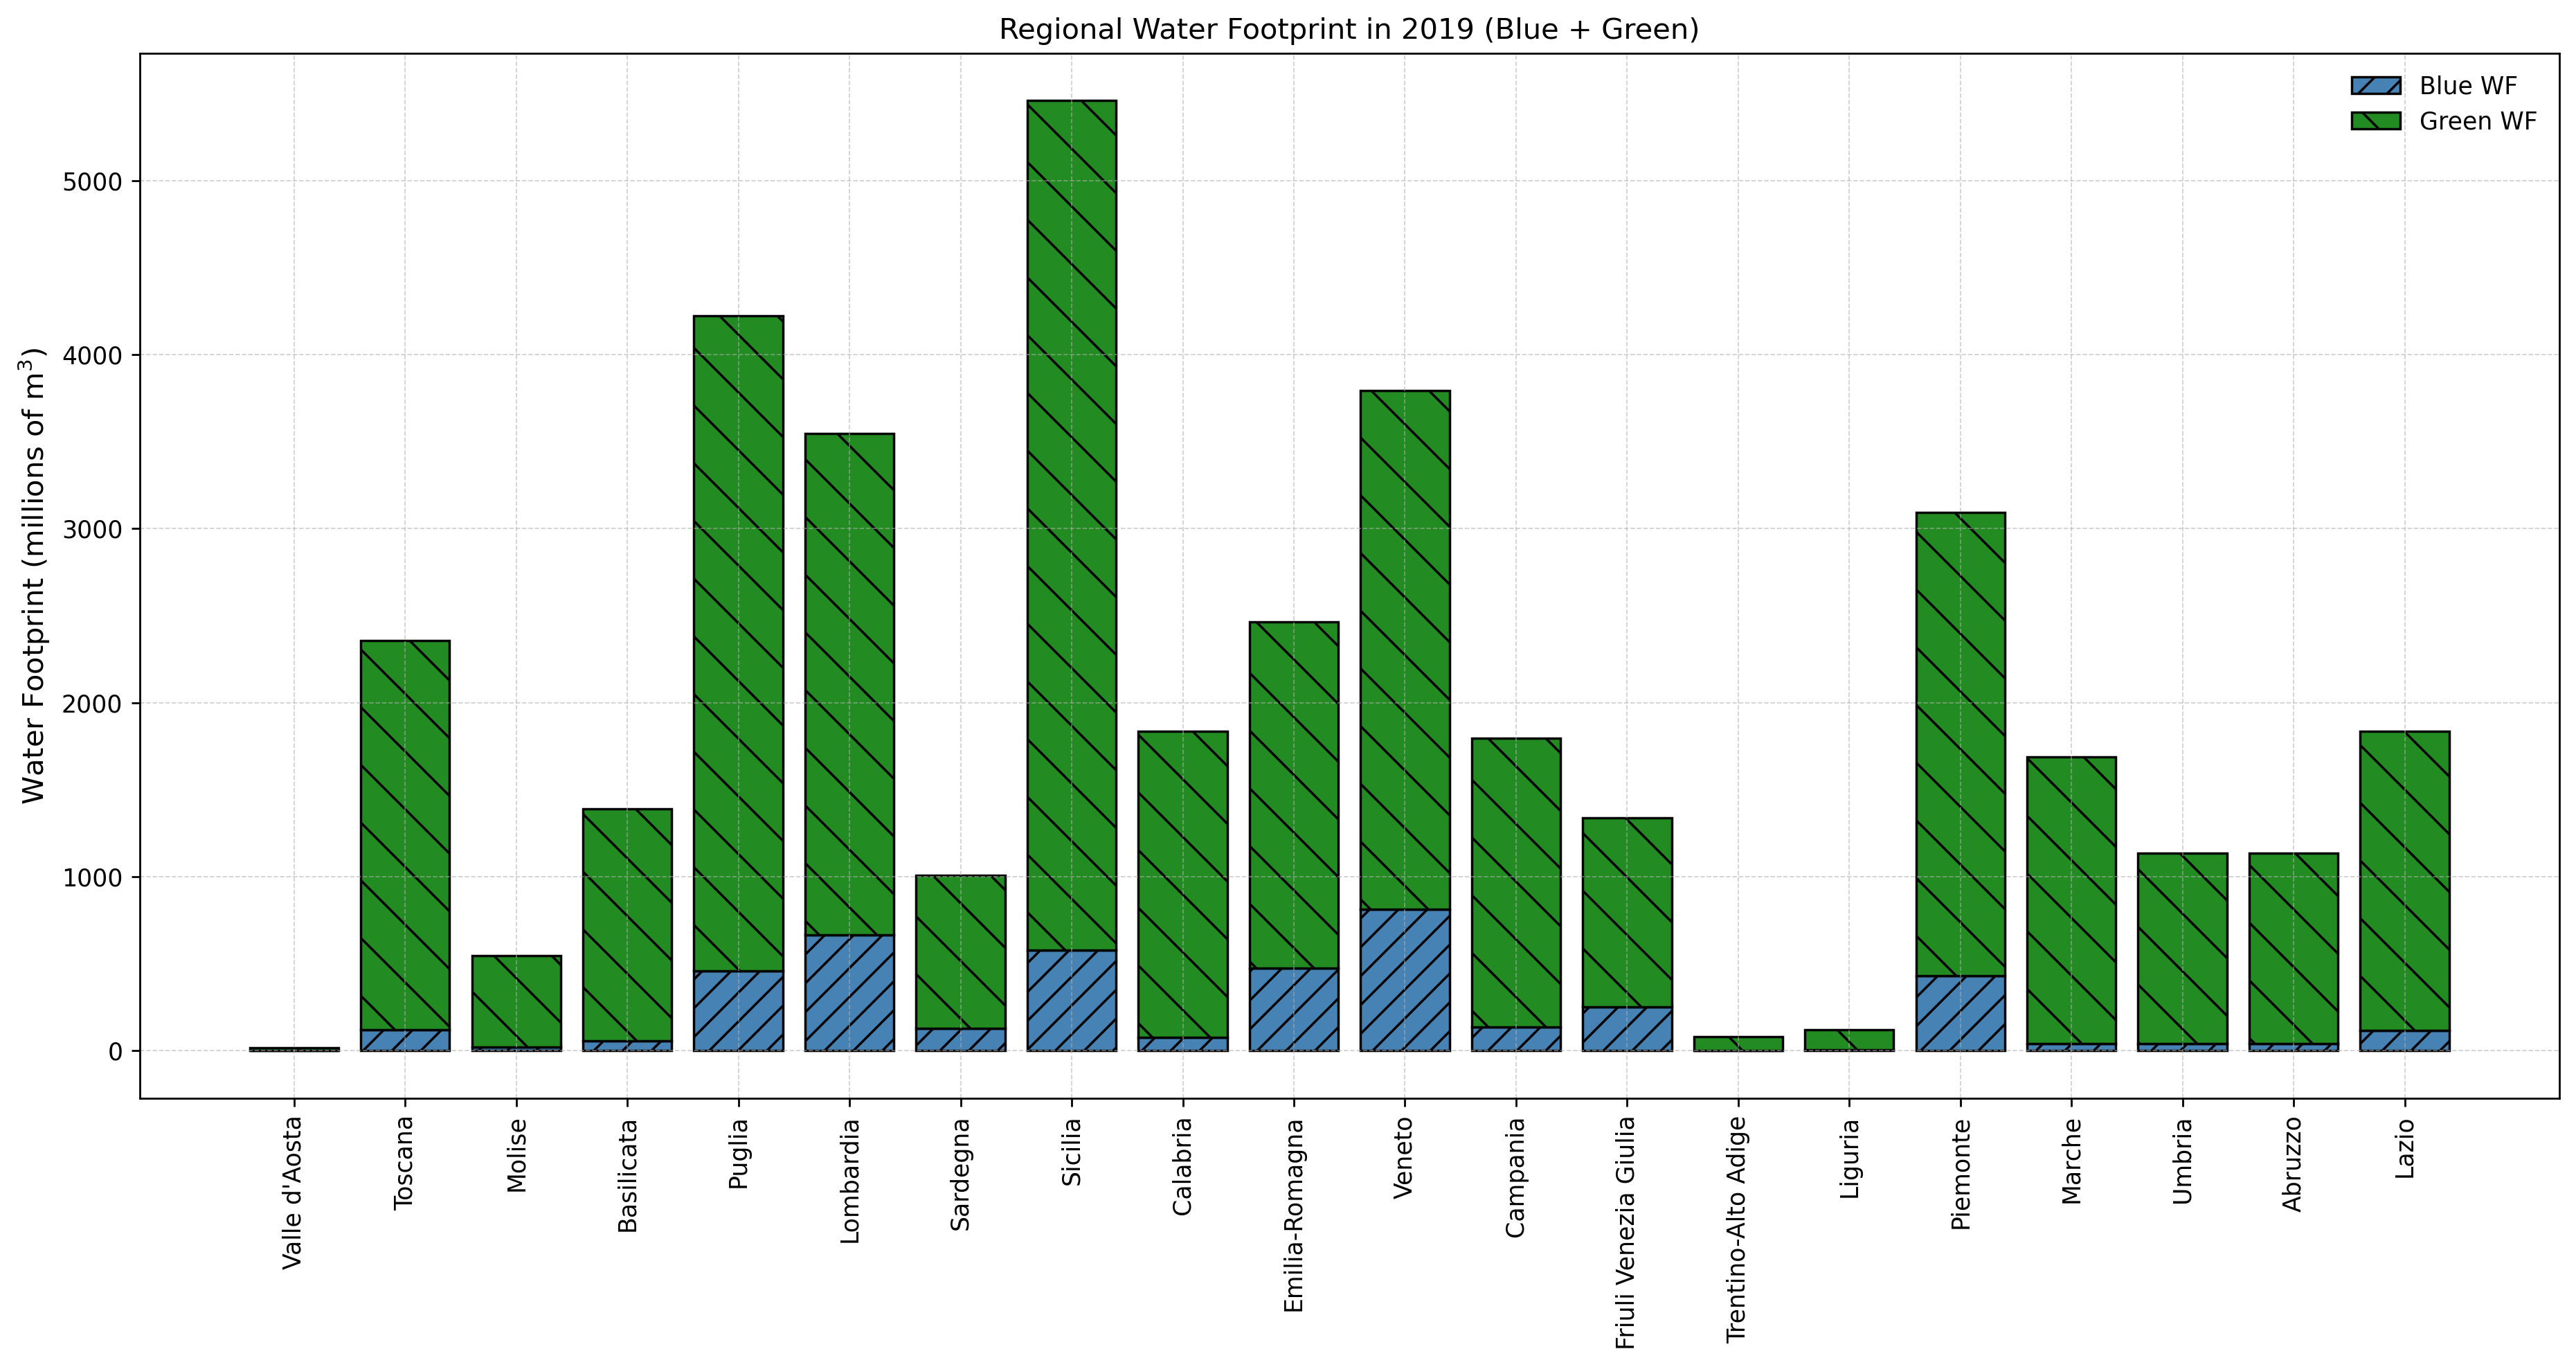
Italian Regions: Total Water Footprint of Production
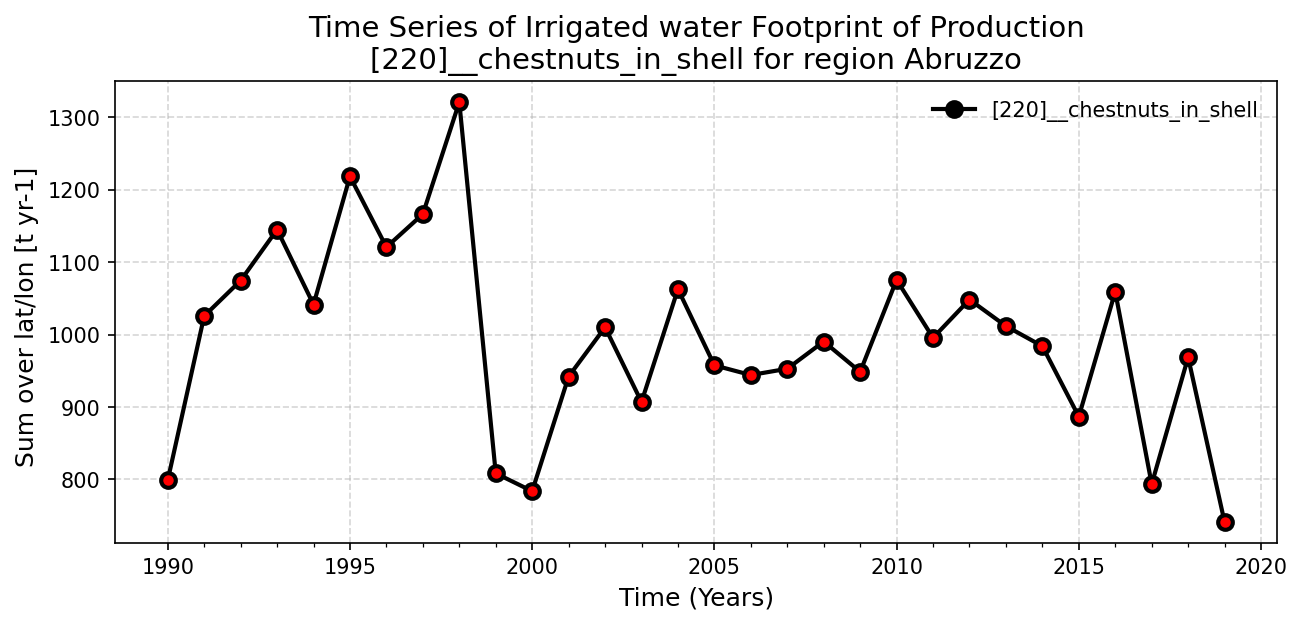
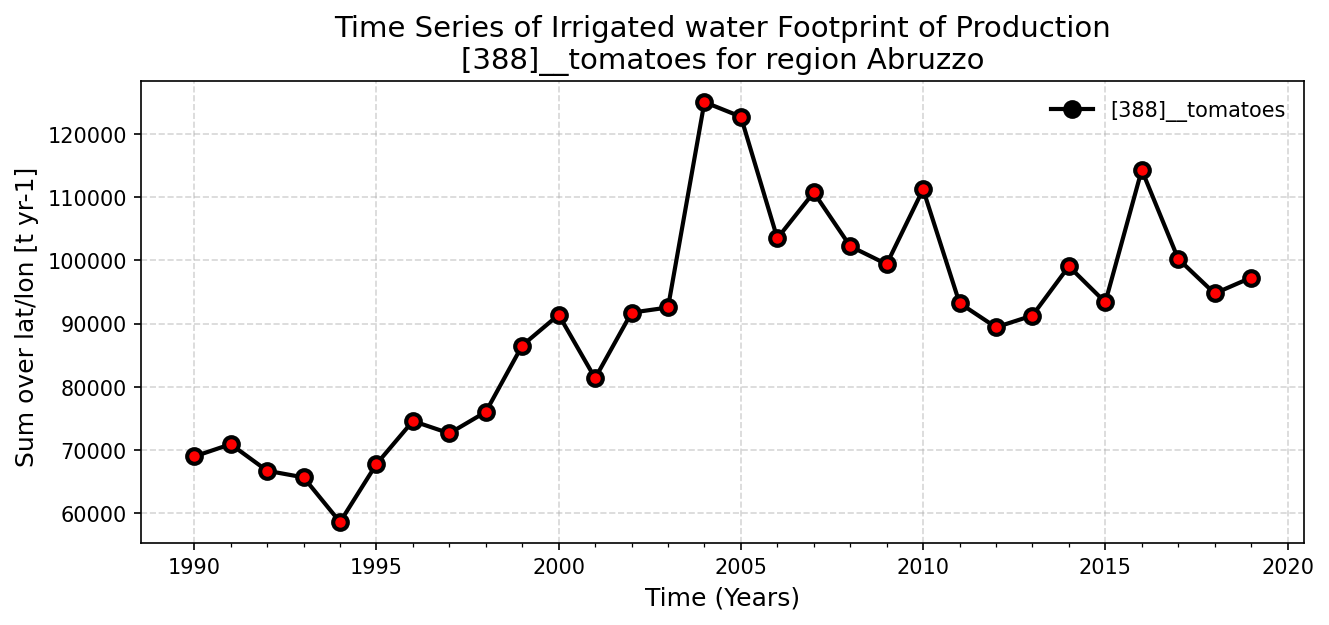
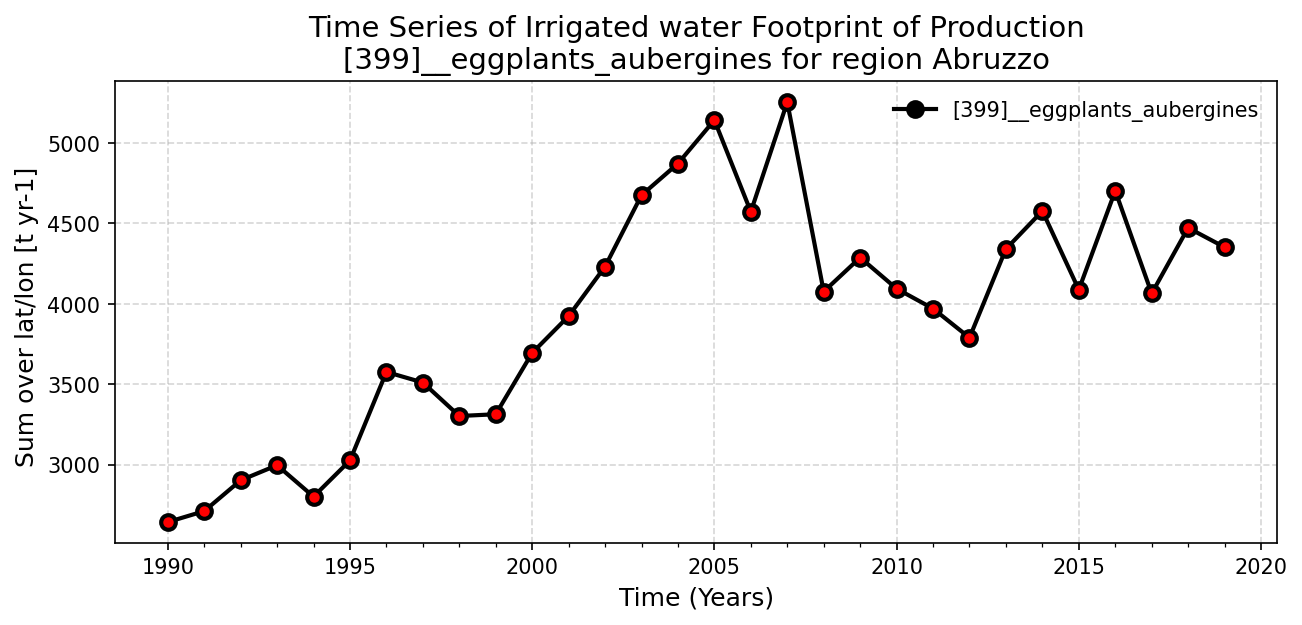
Italy: Time Series per Crop & Region
Time Series of Total Irrigated Blue per Region for the first 24 Crops
Total Water Footprint of Production per Crop and per Region
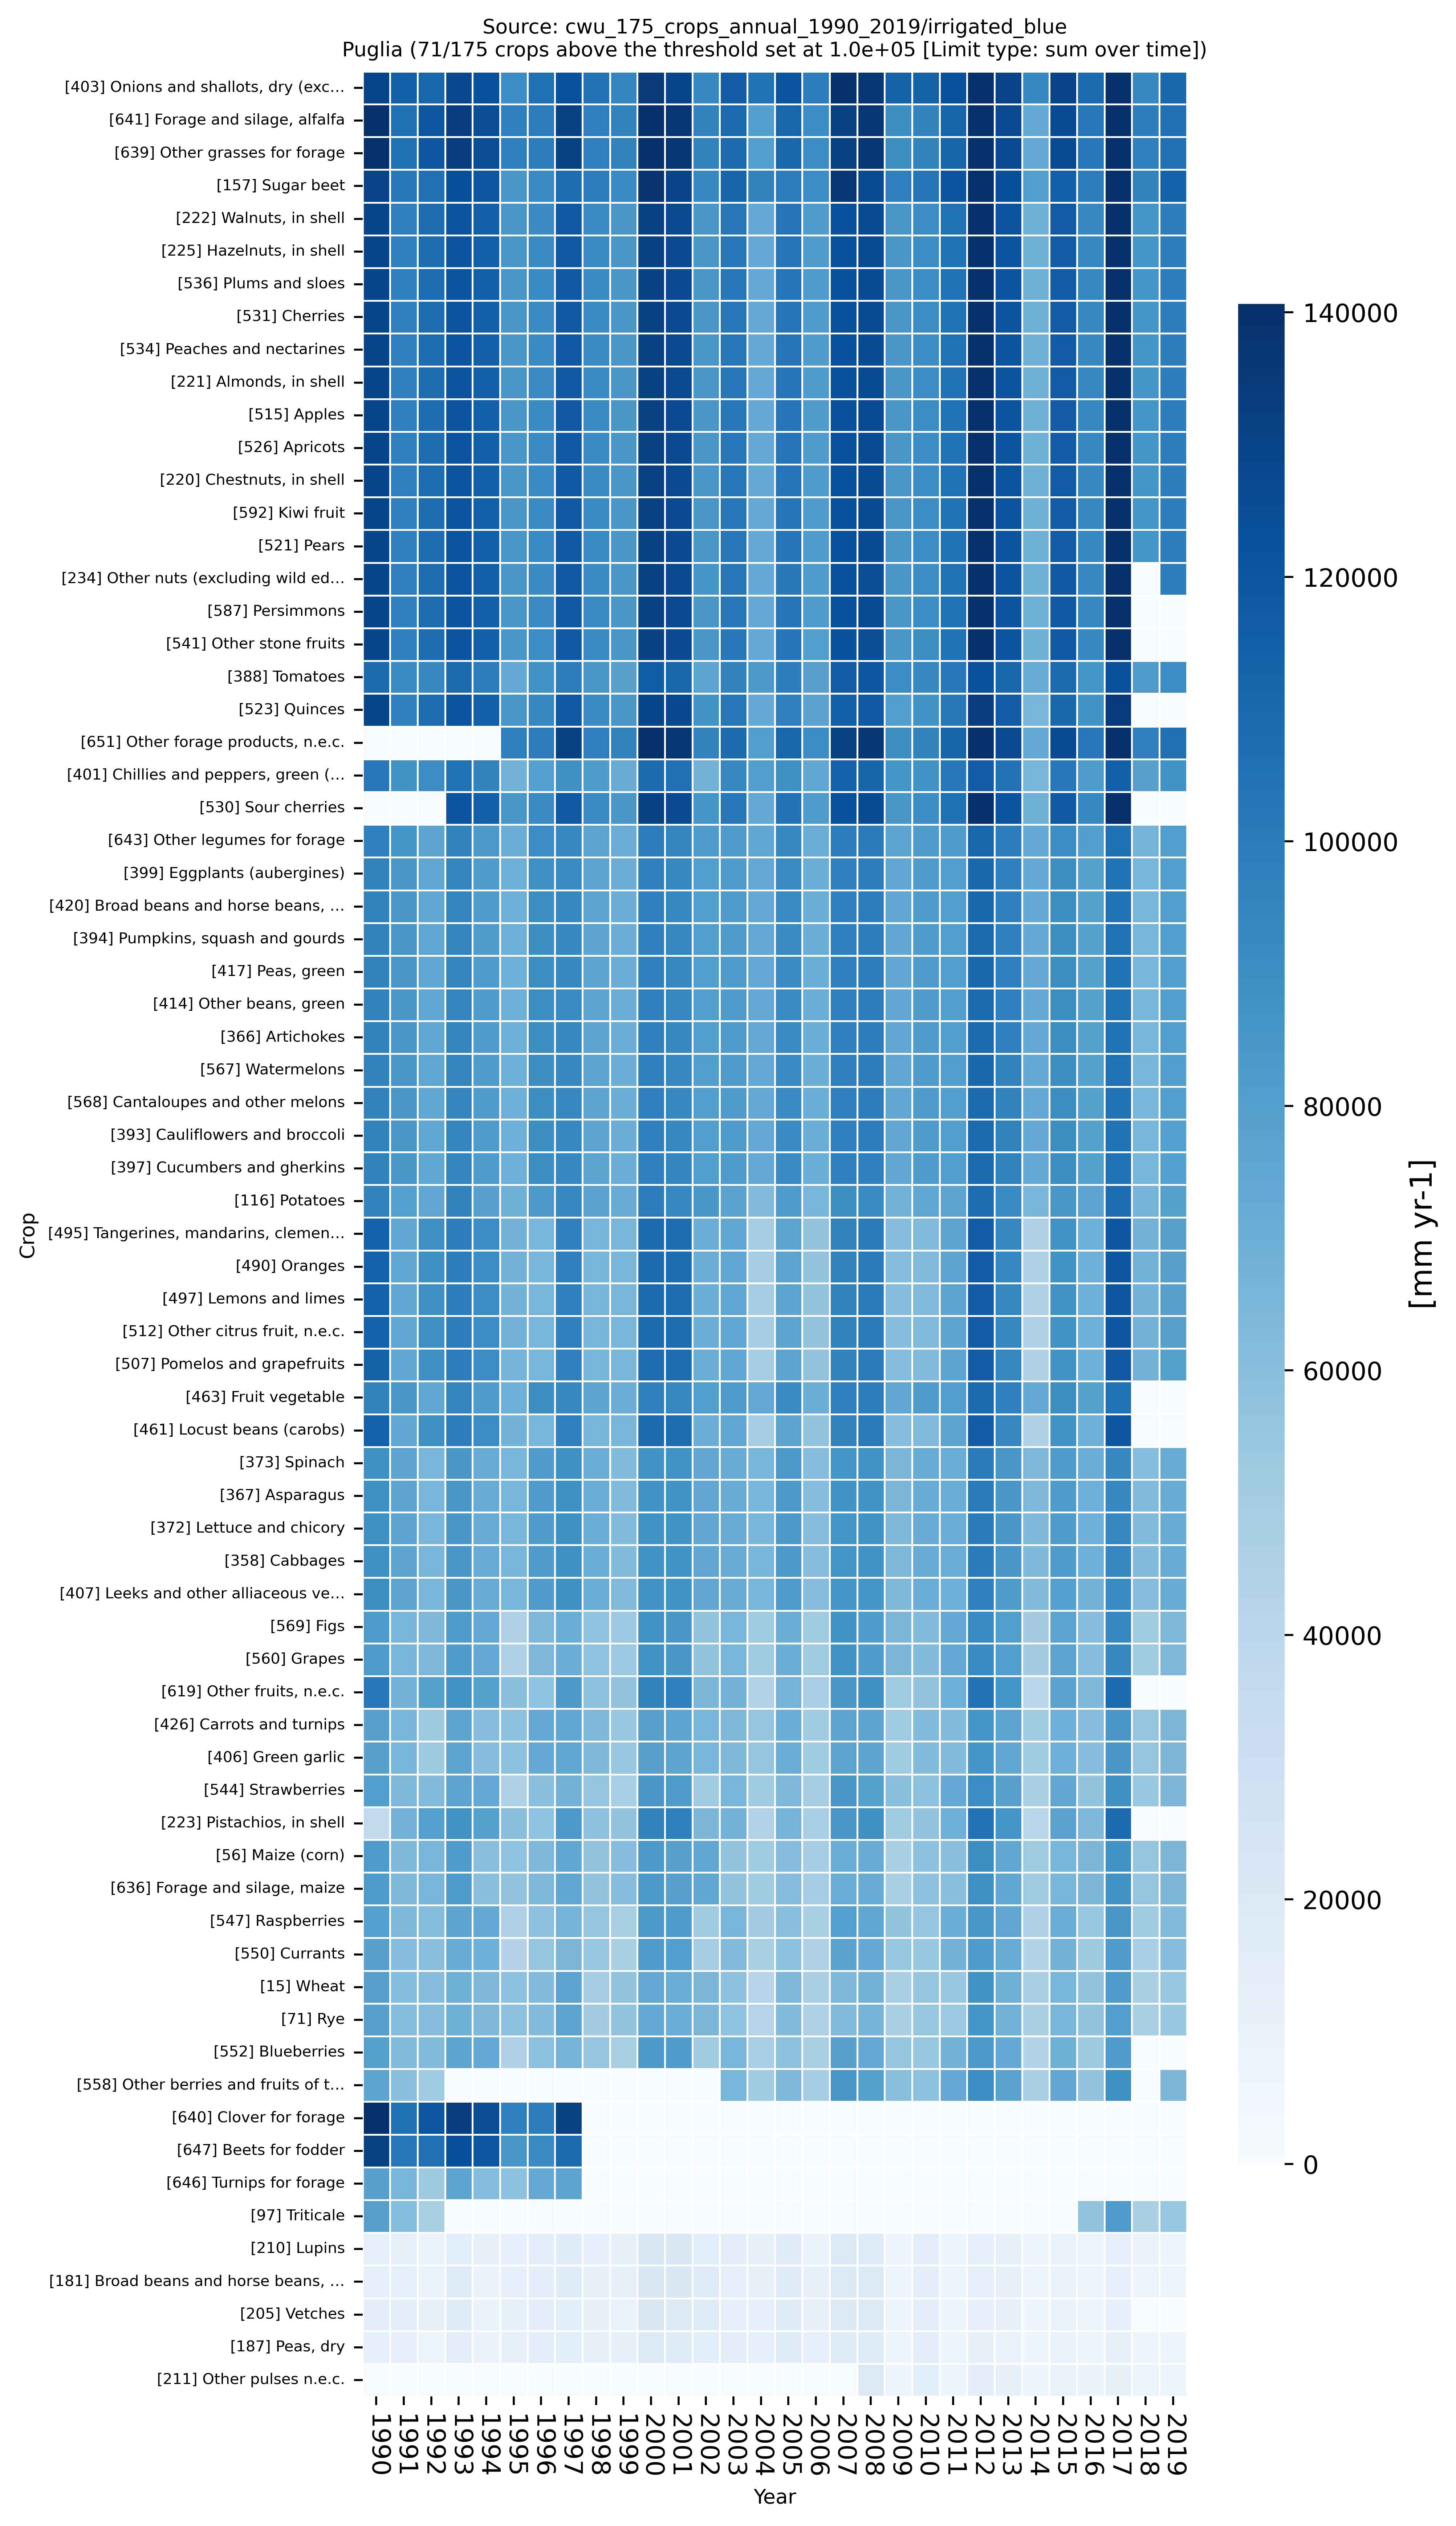
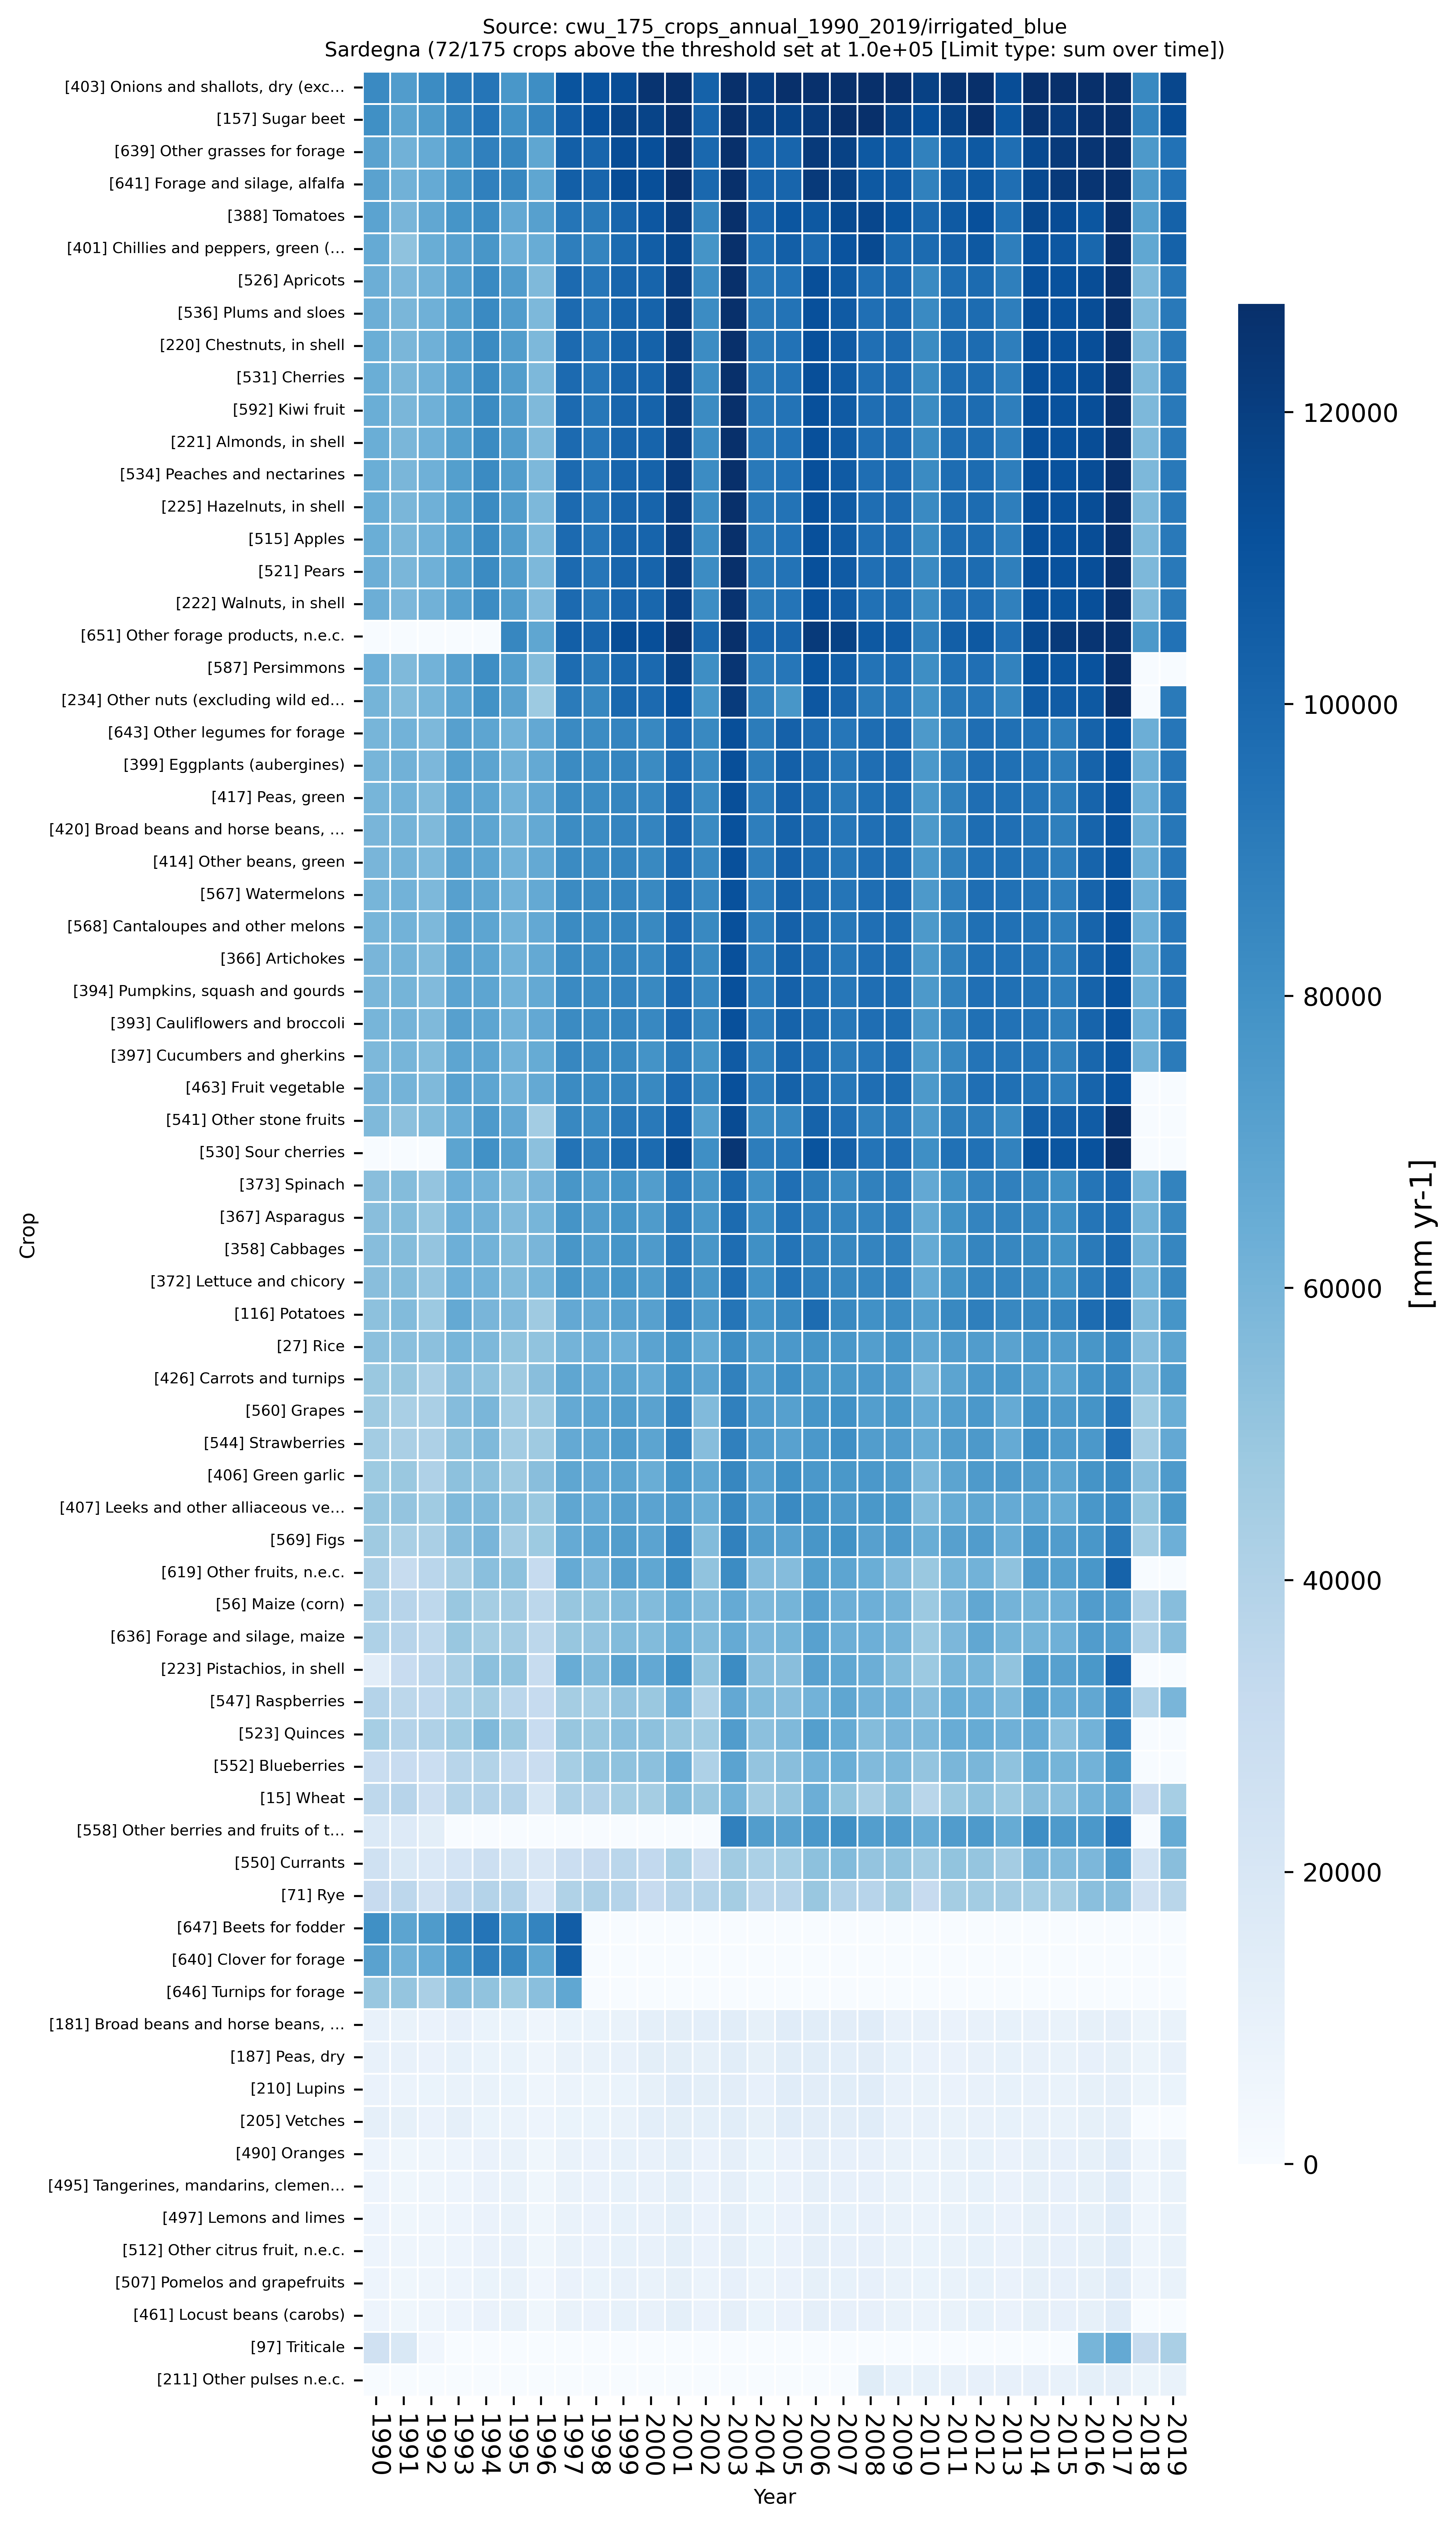
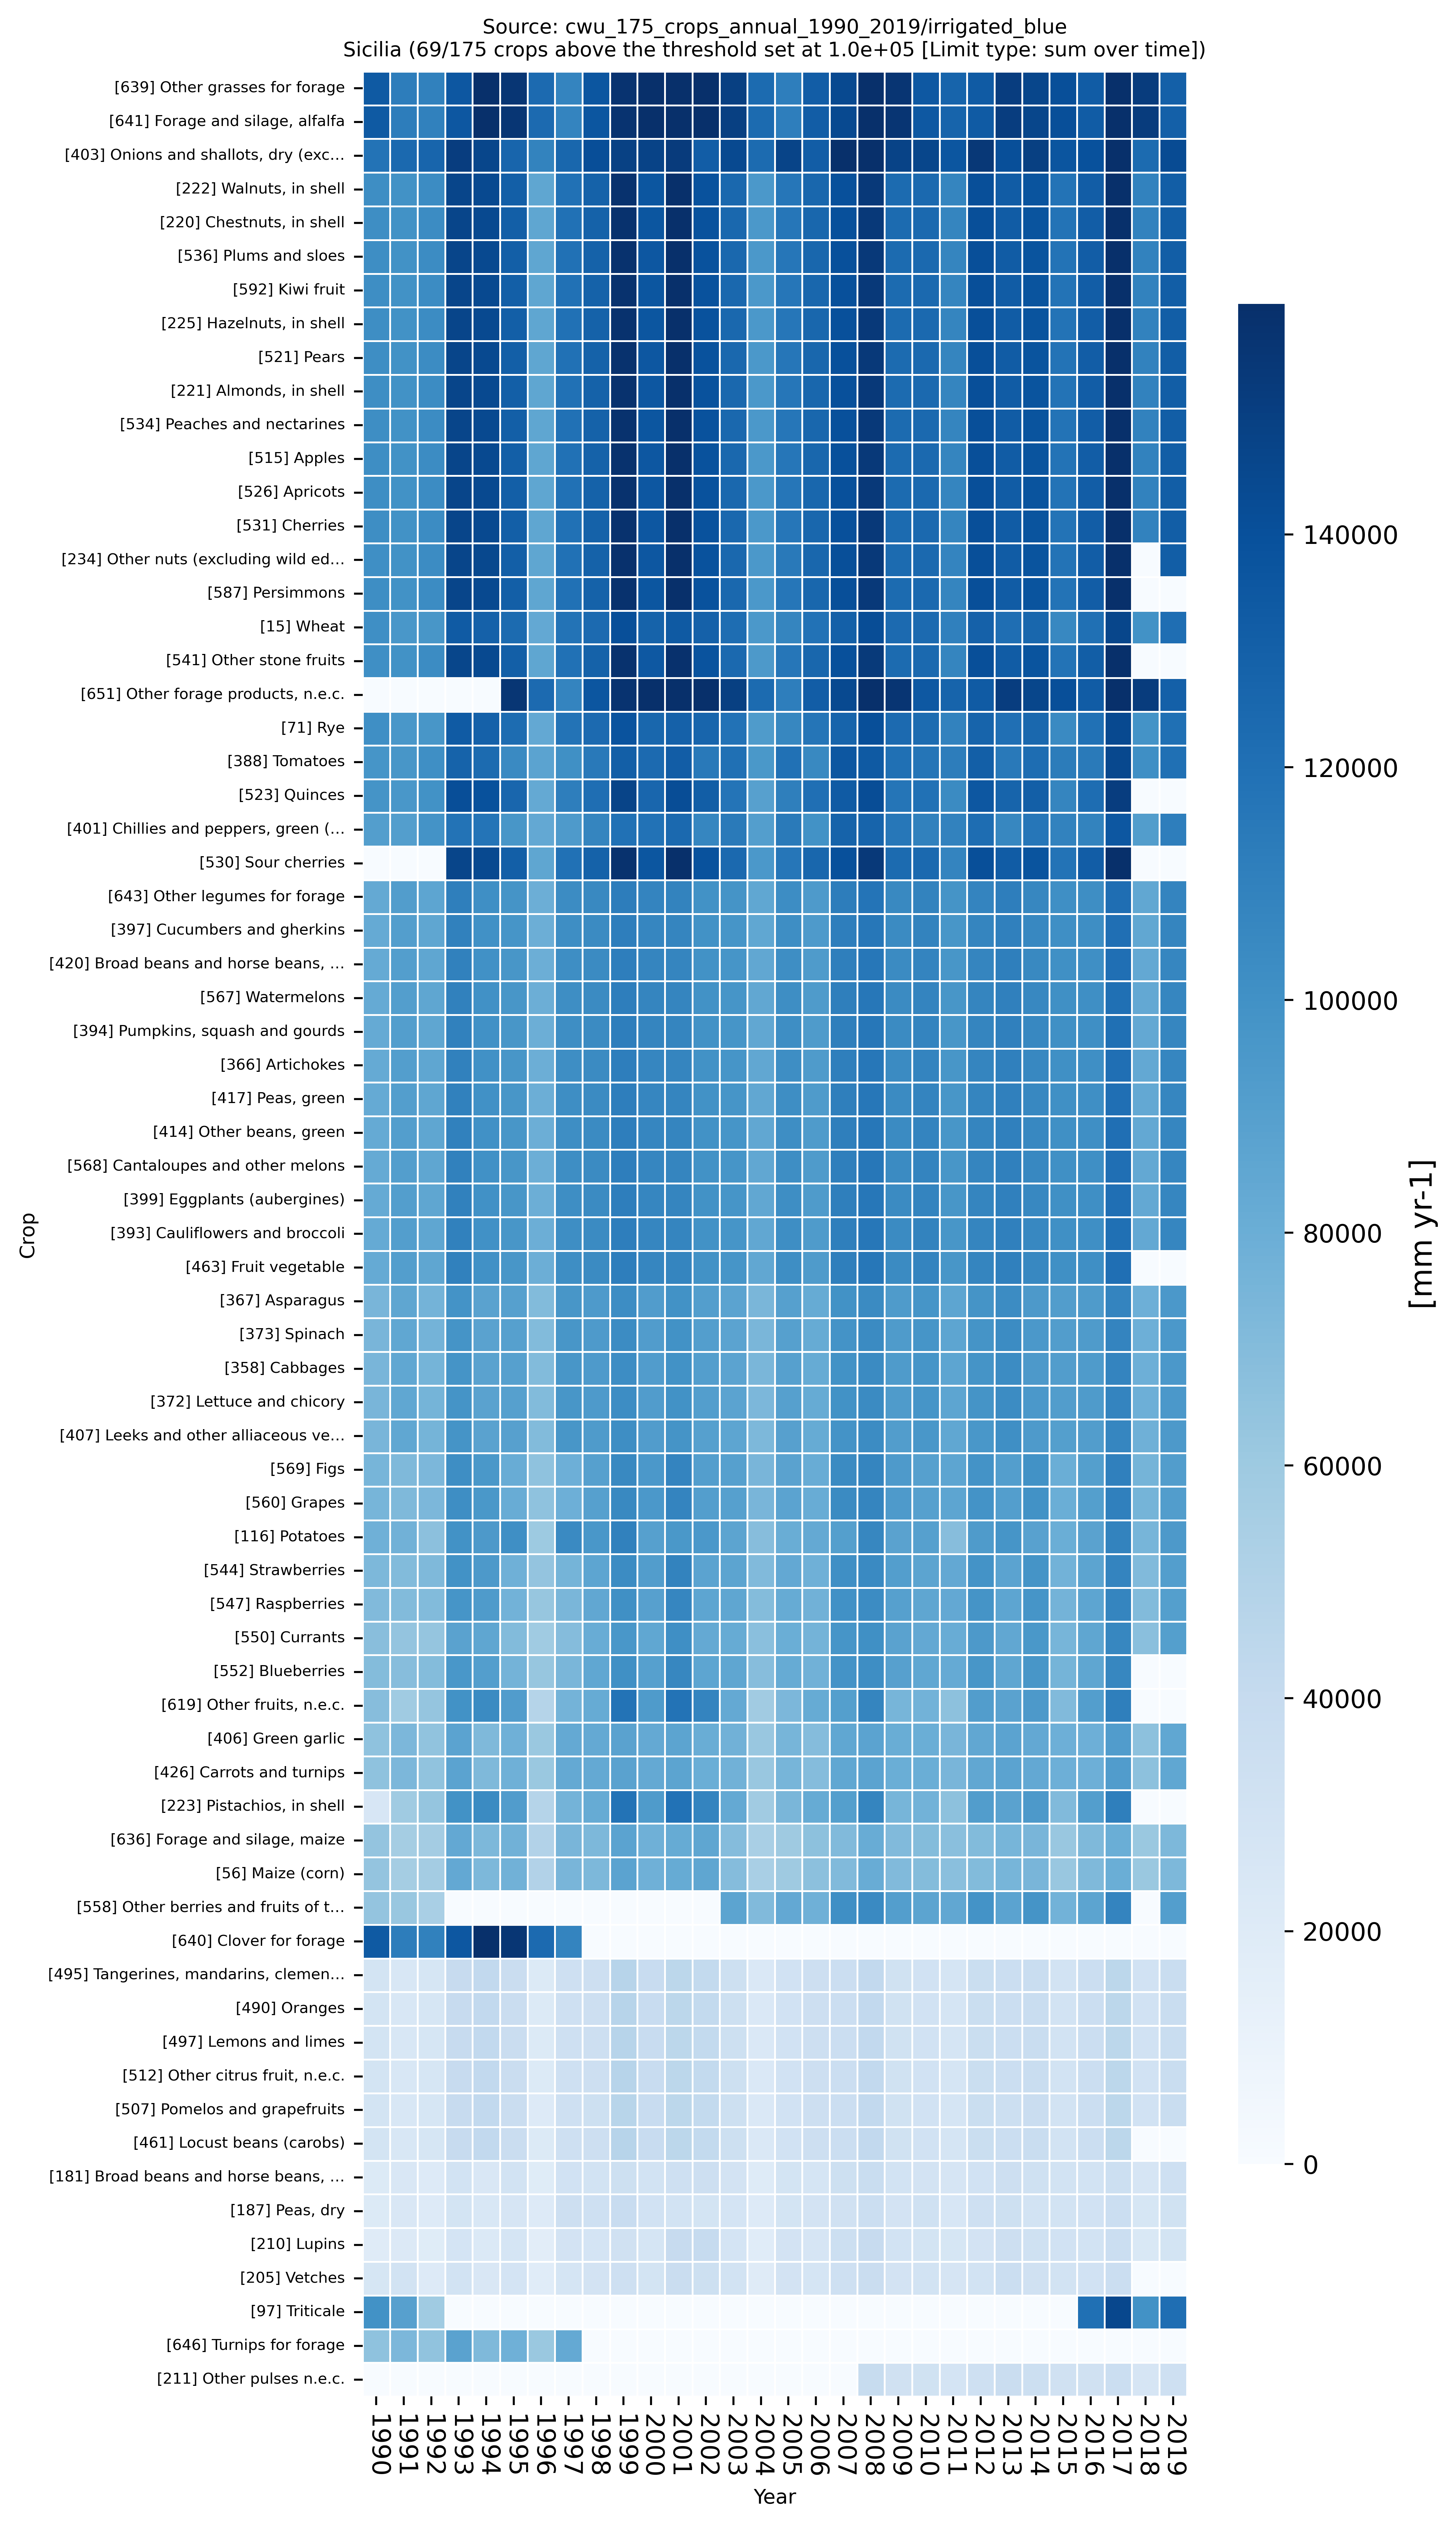
Crops irrigation intensity per region Heatmaps over Time
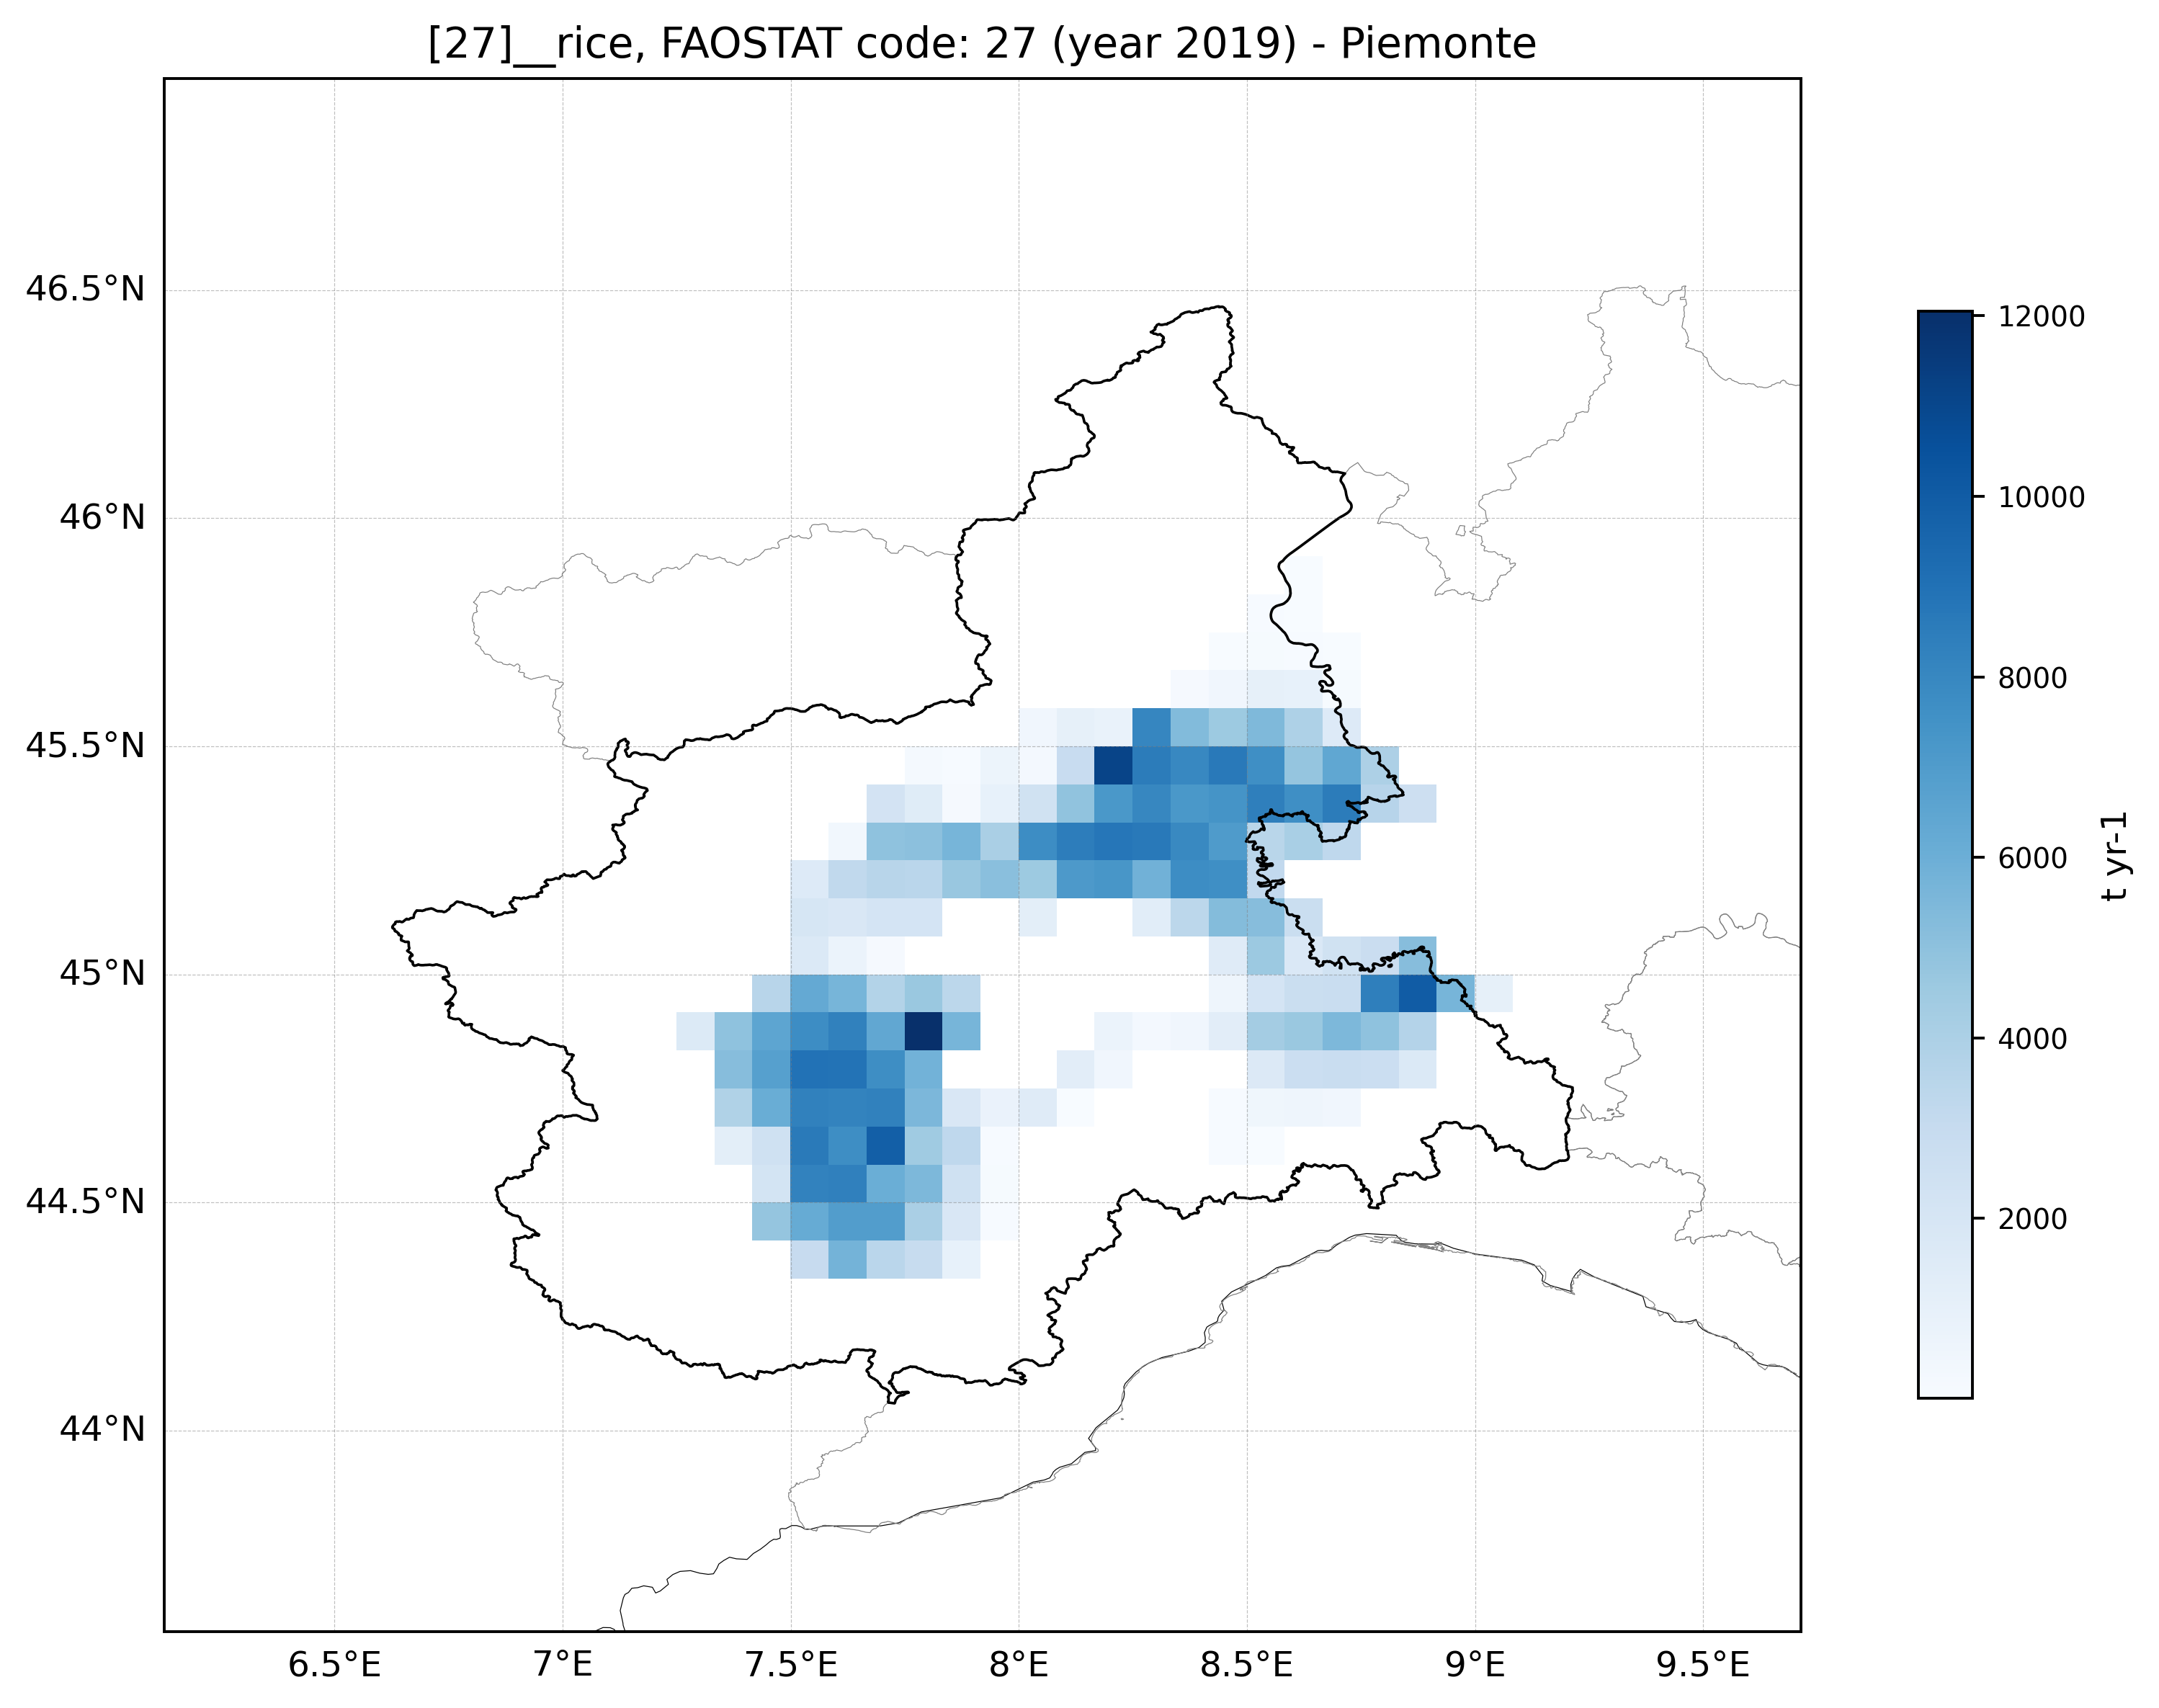
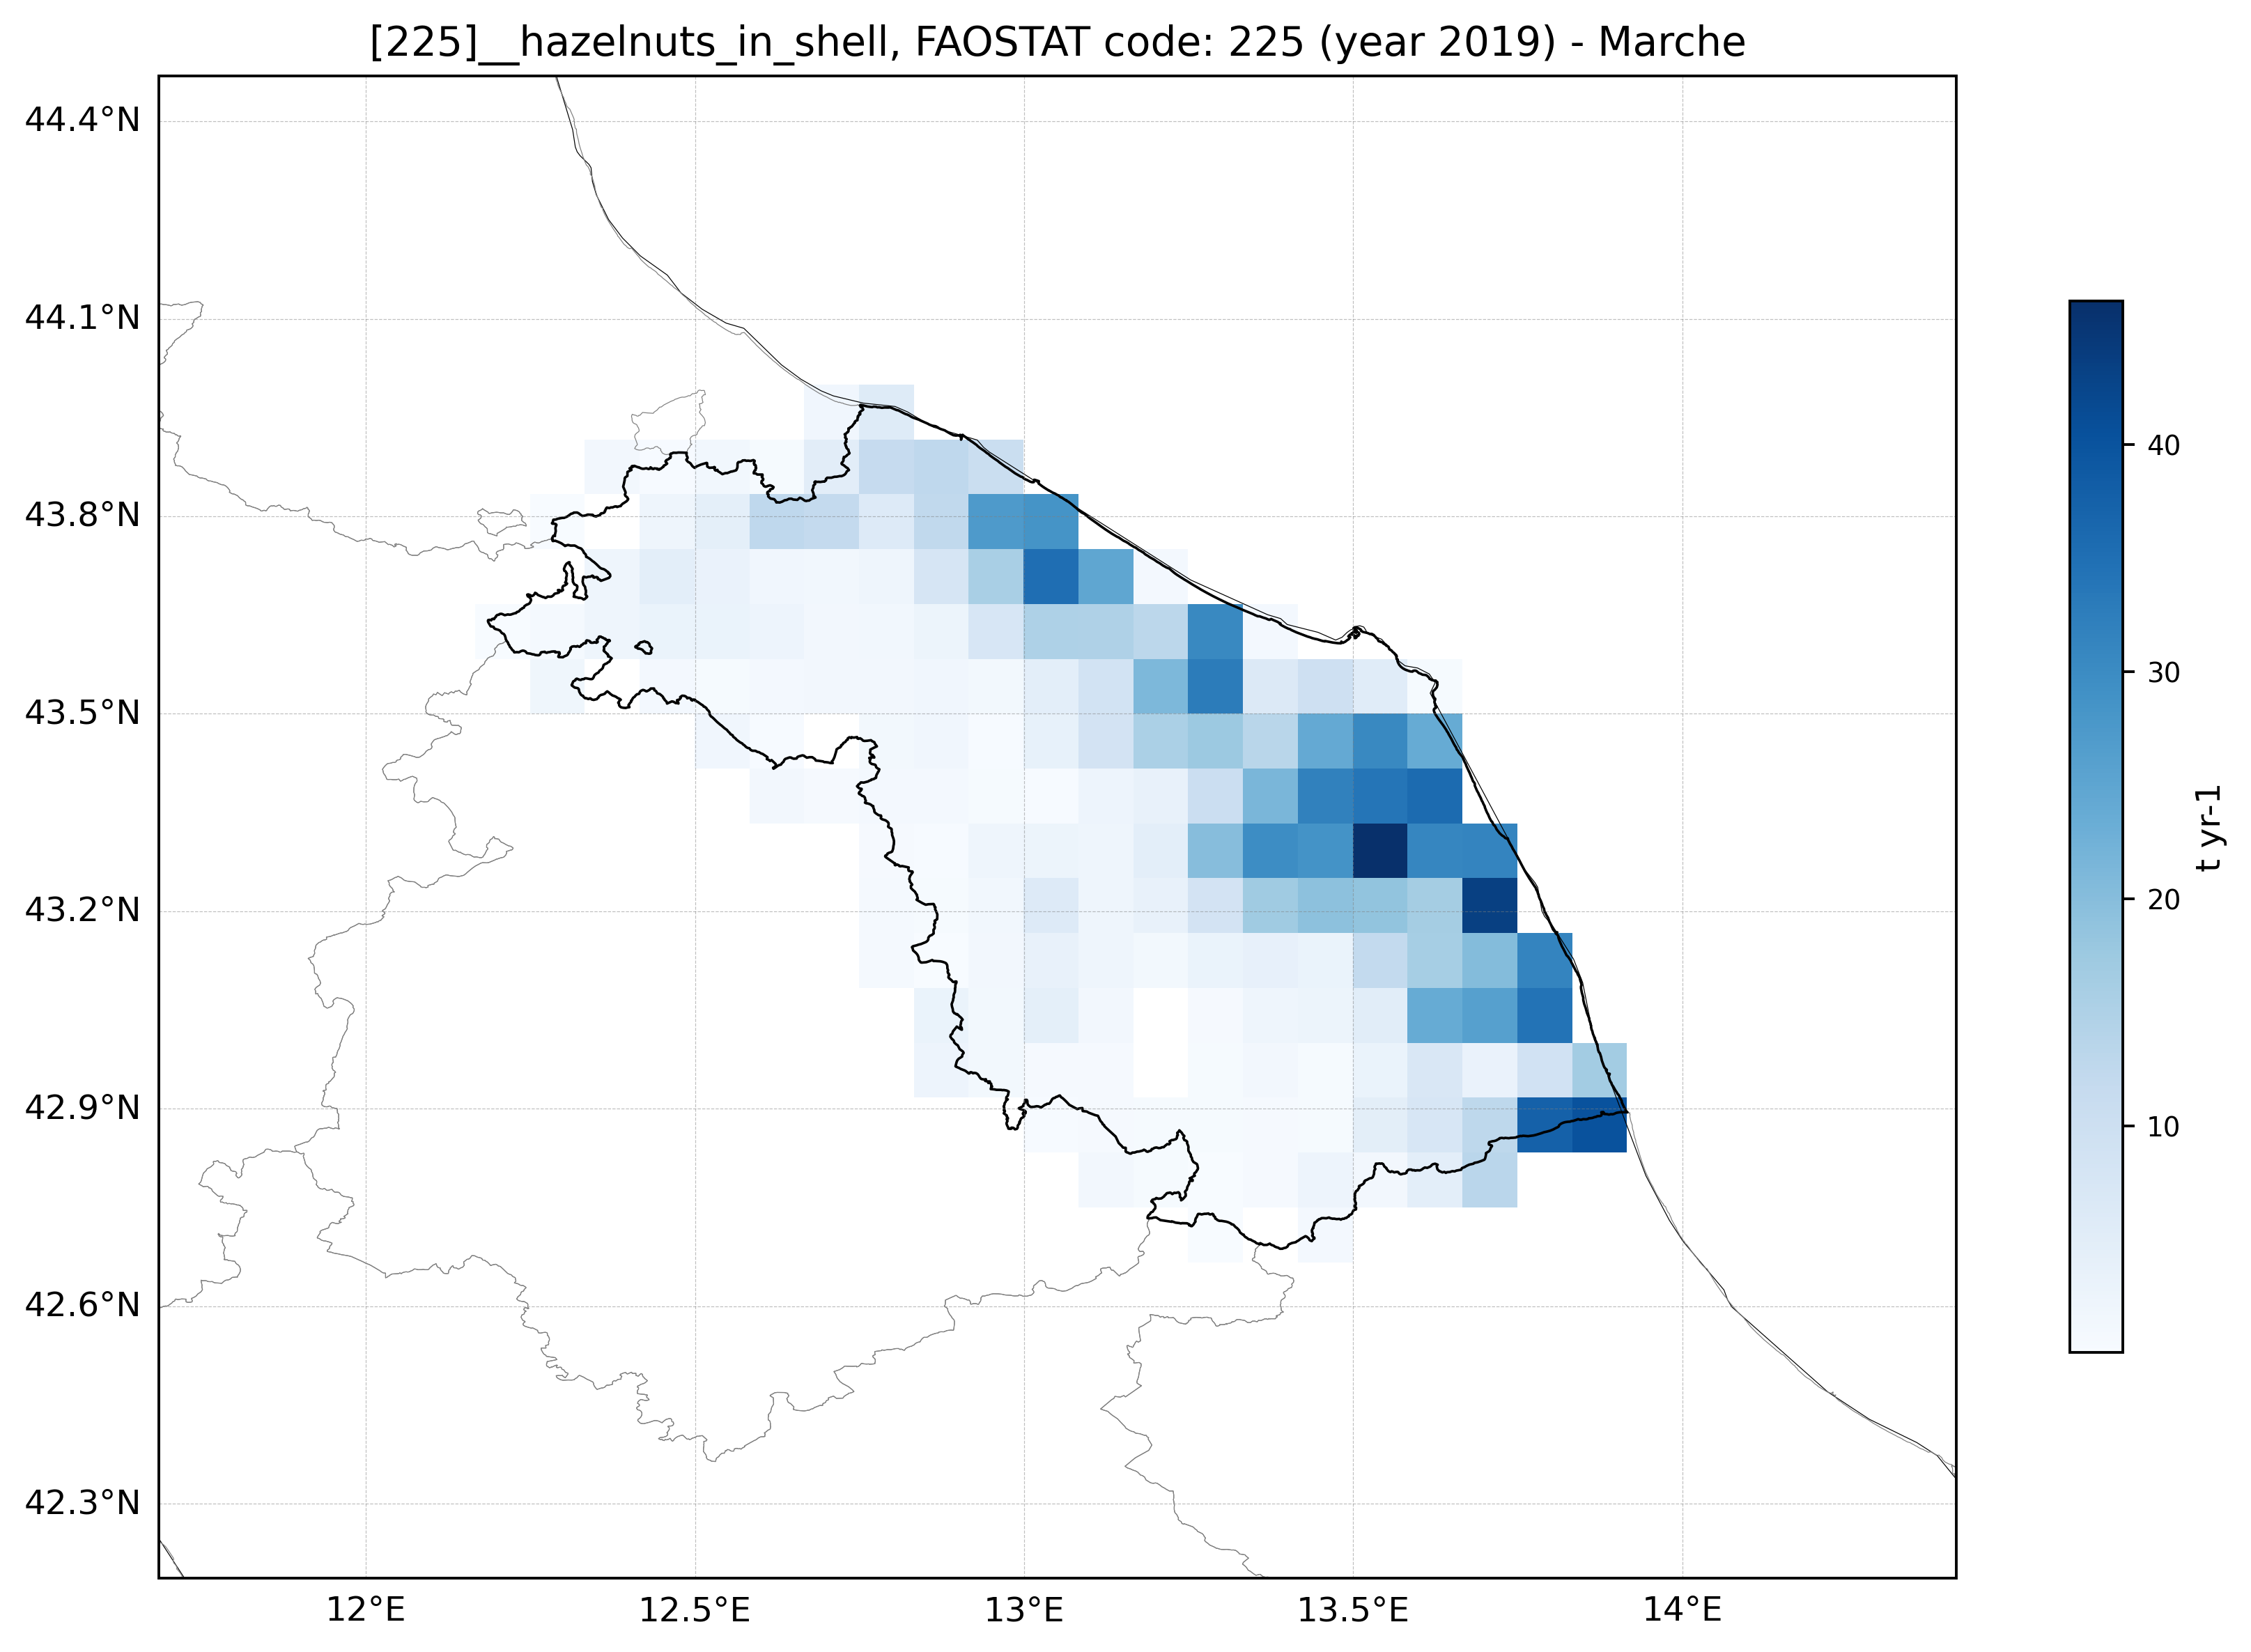
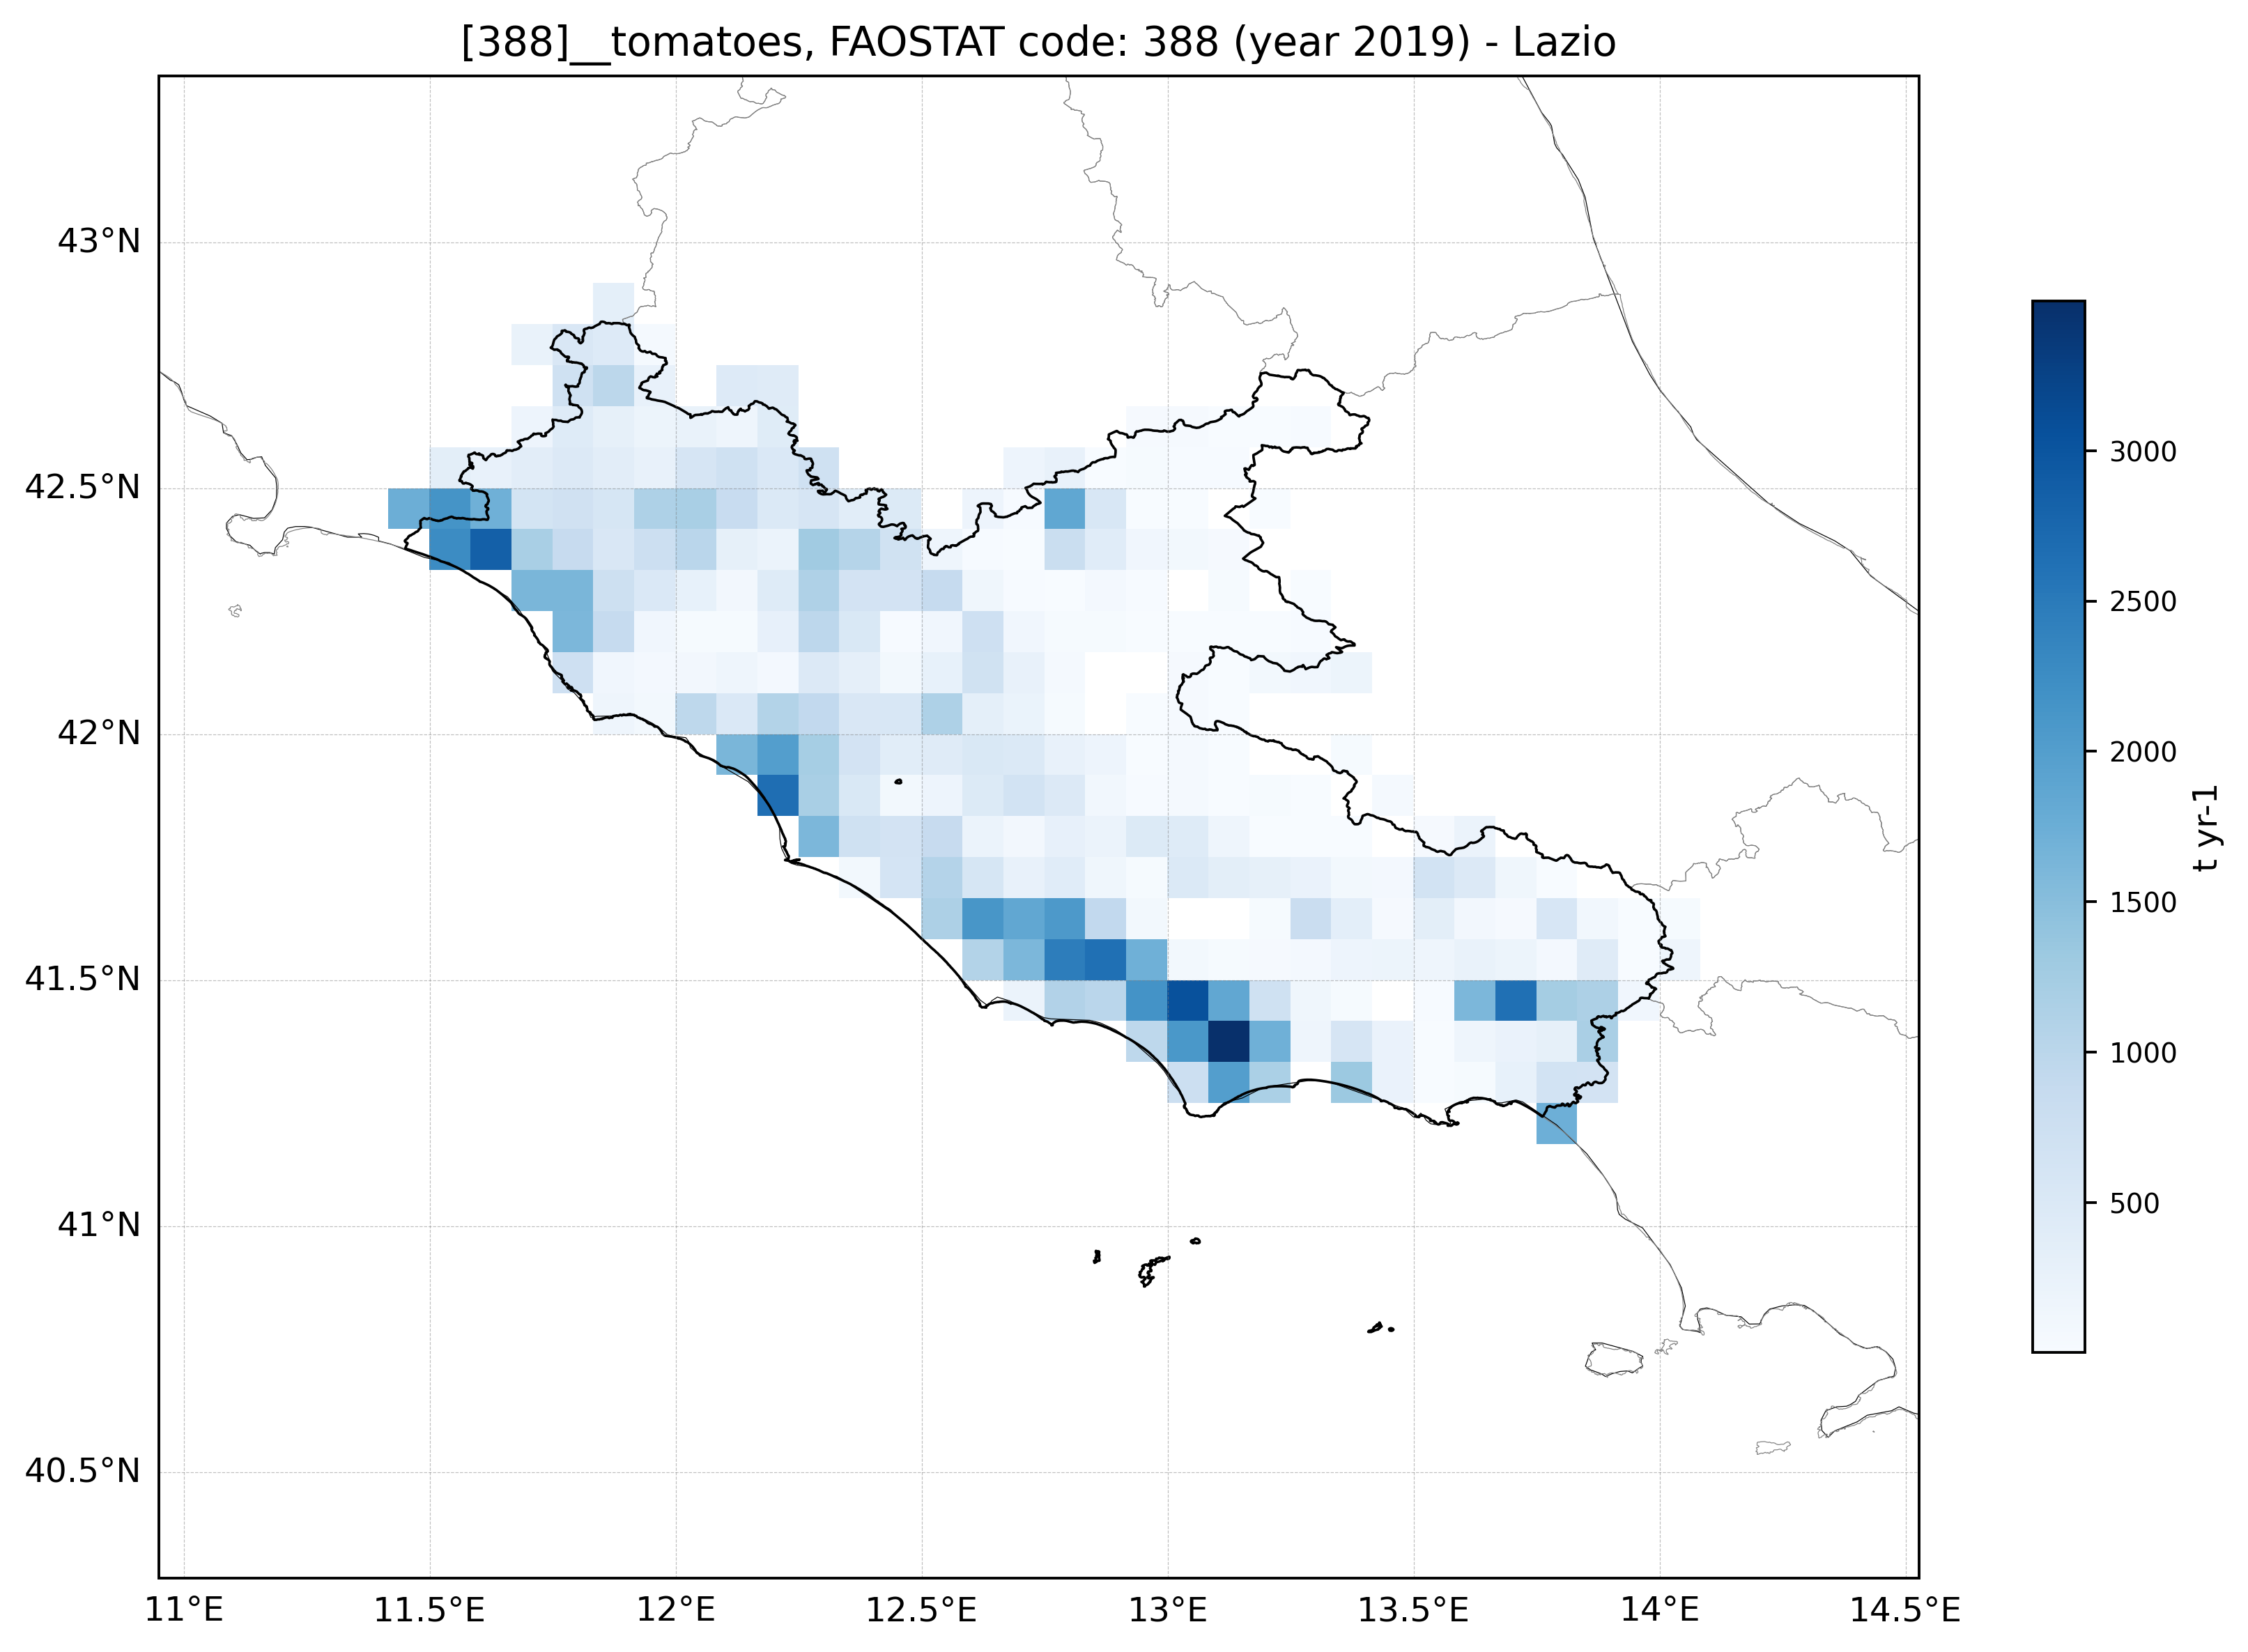
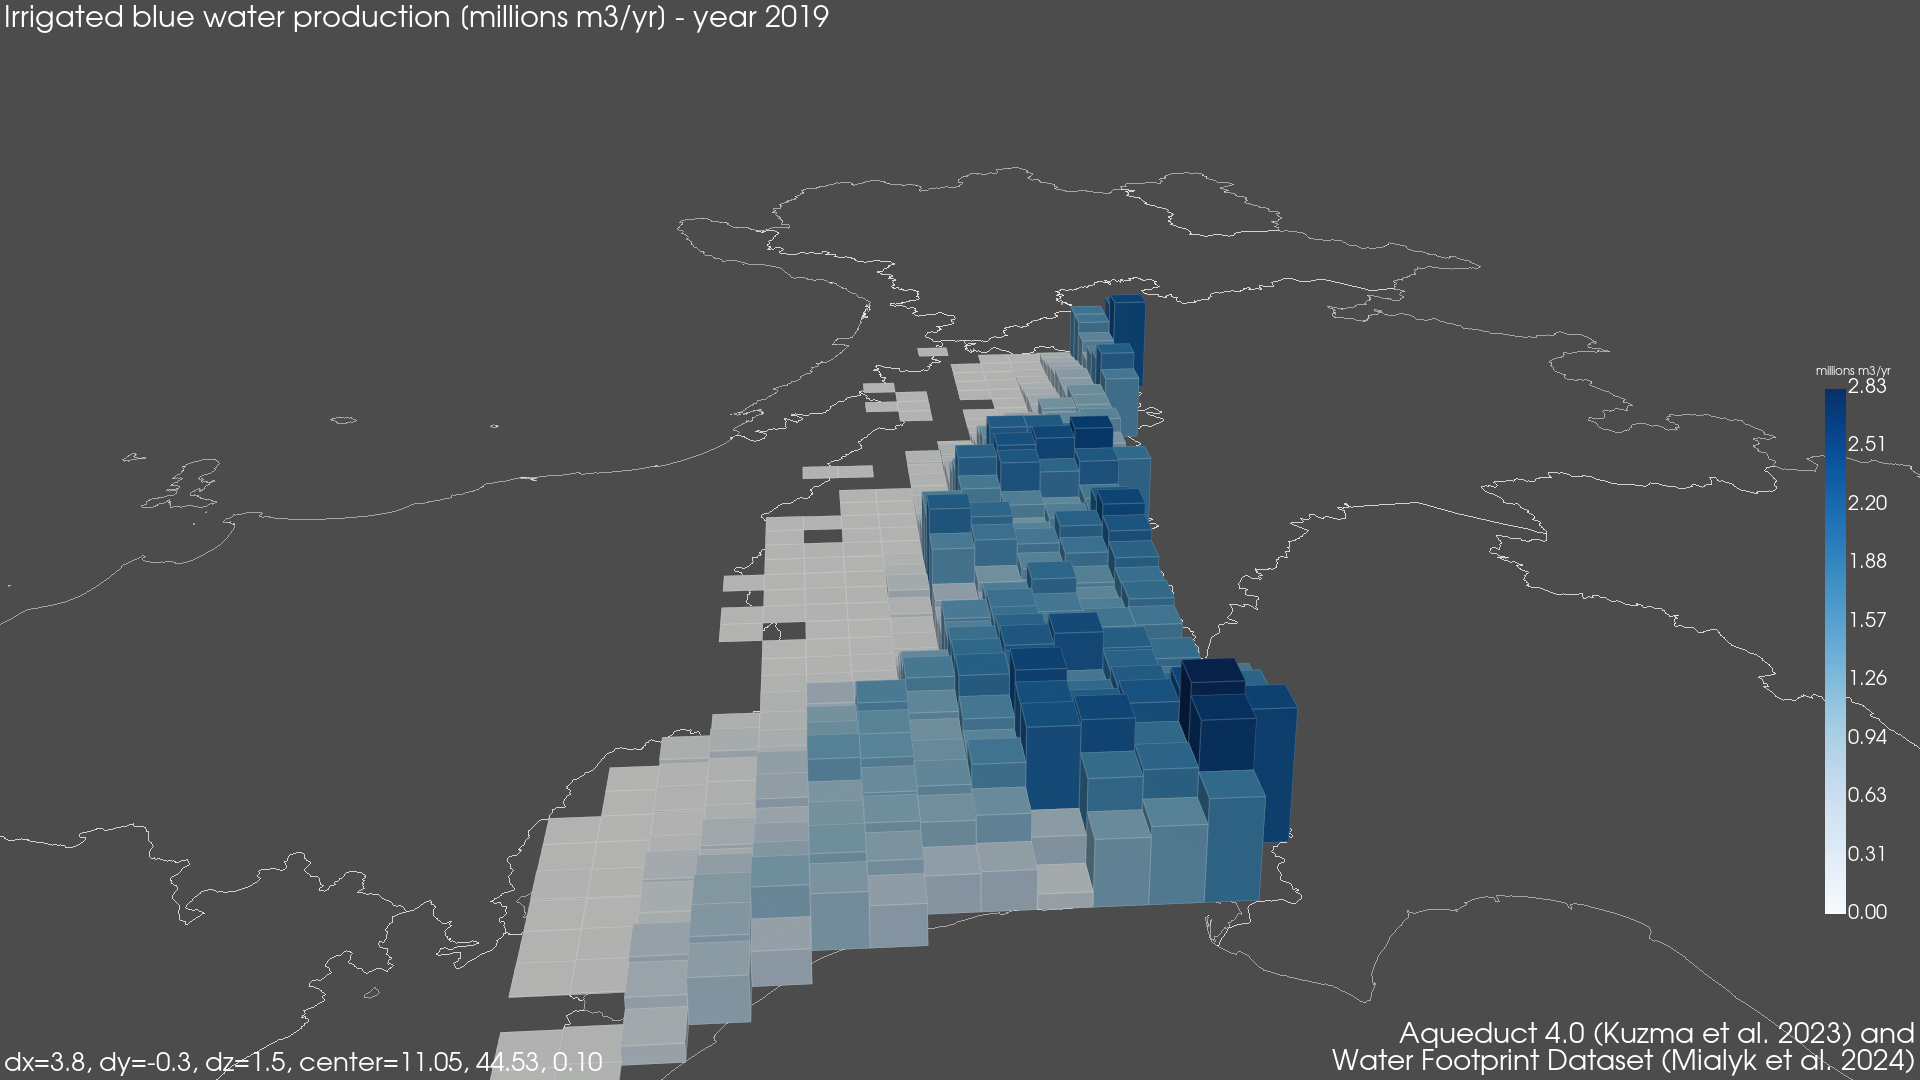
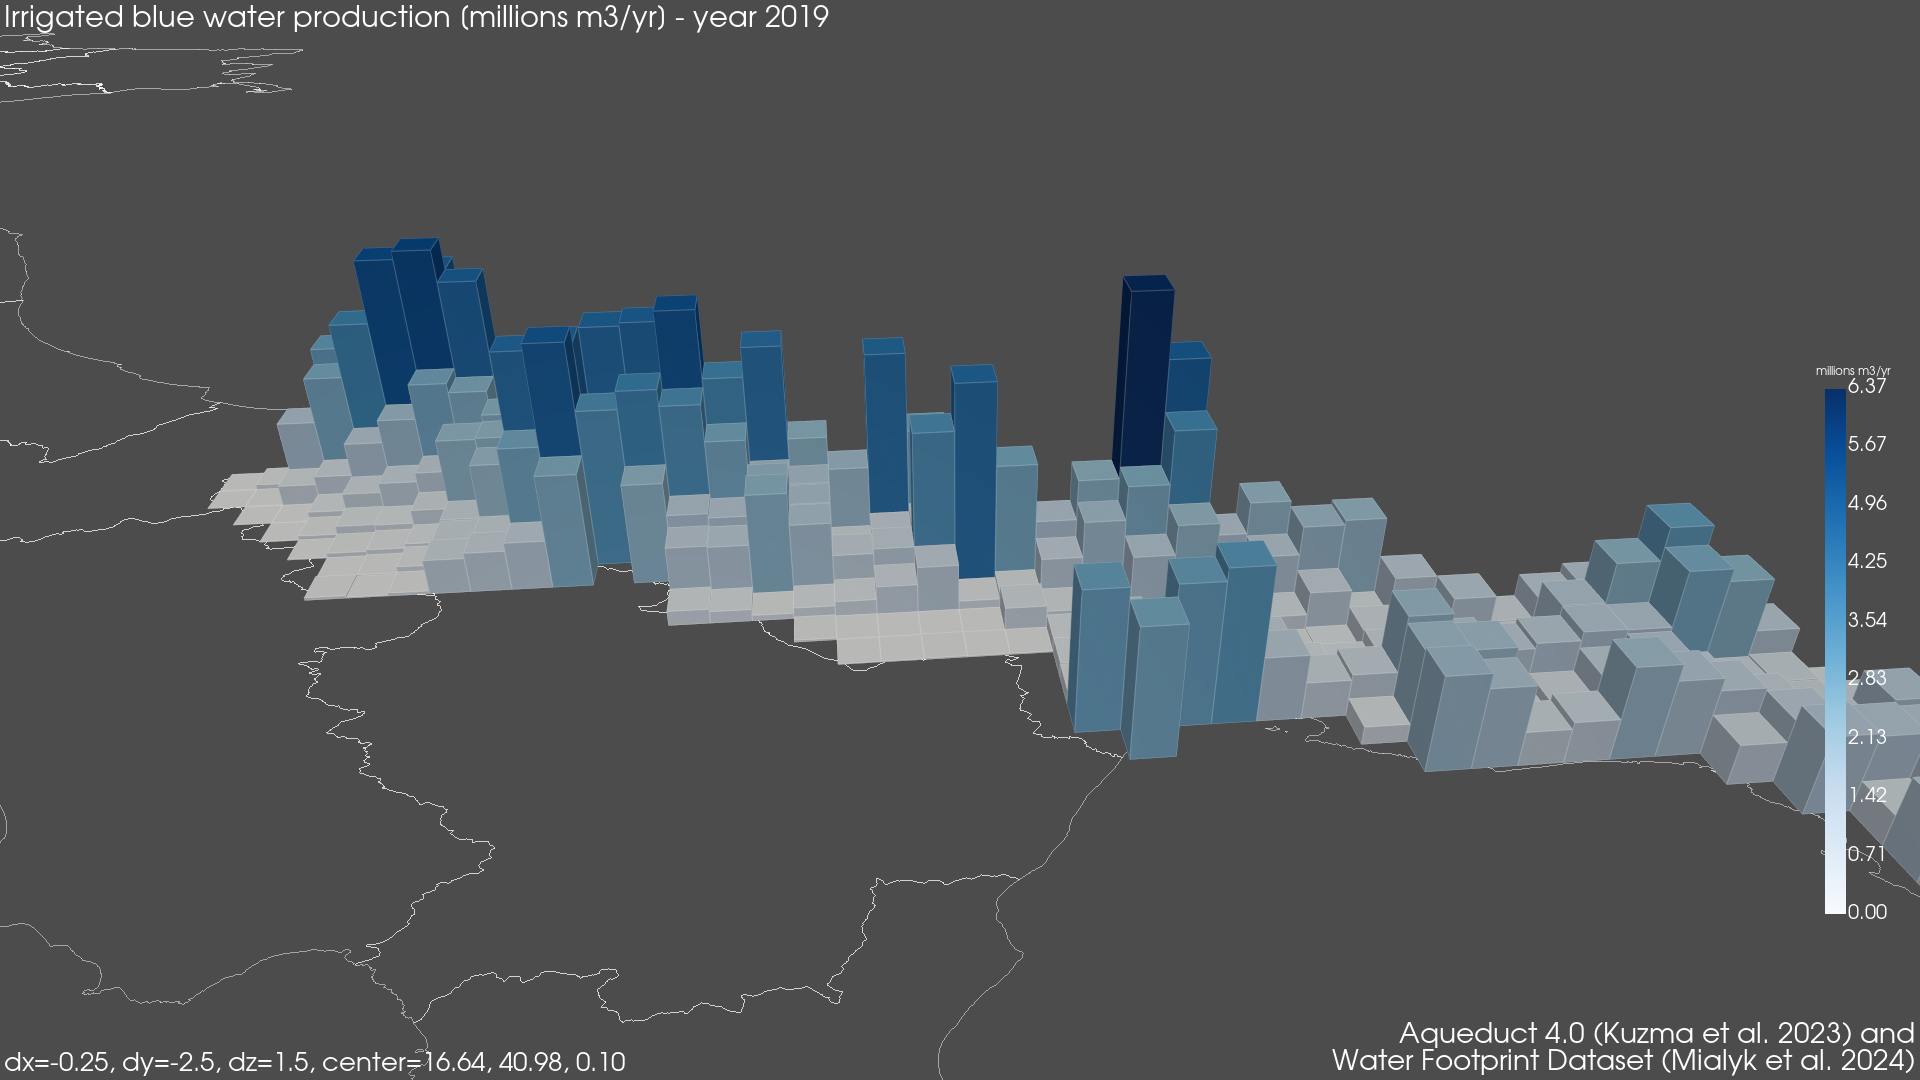
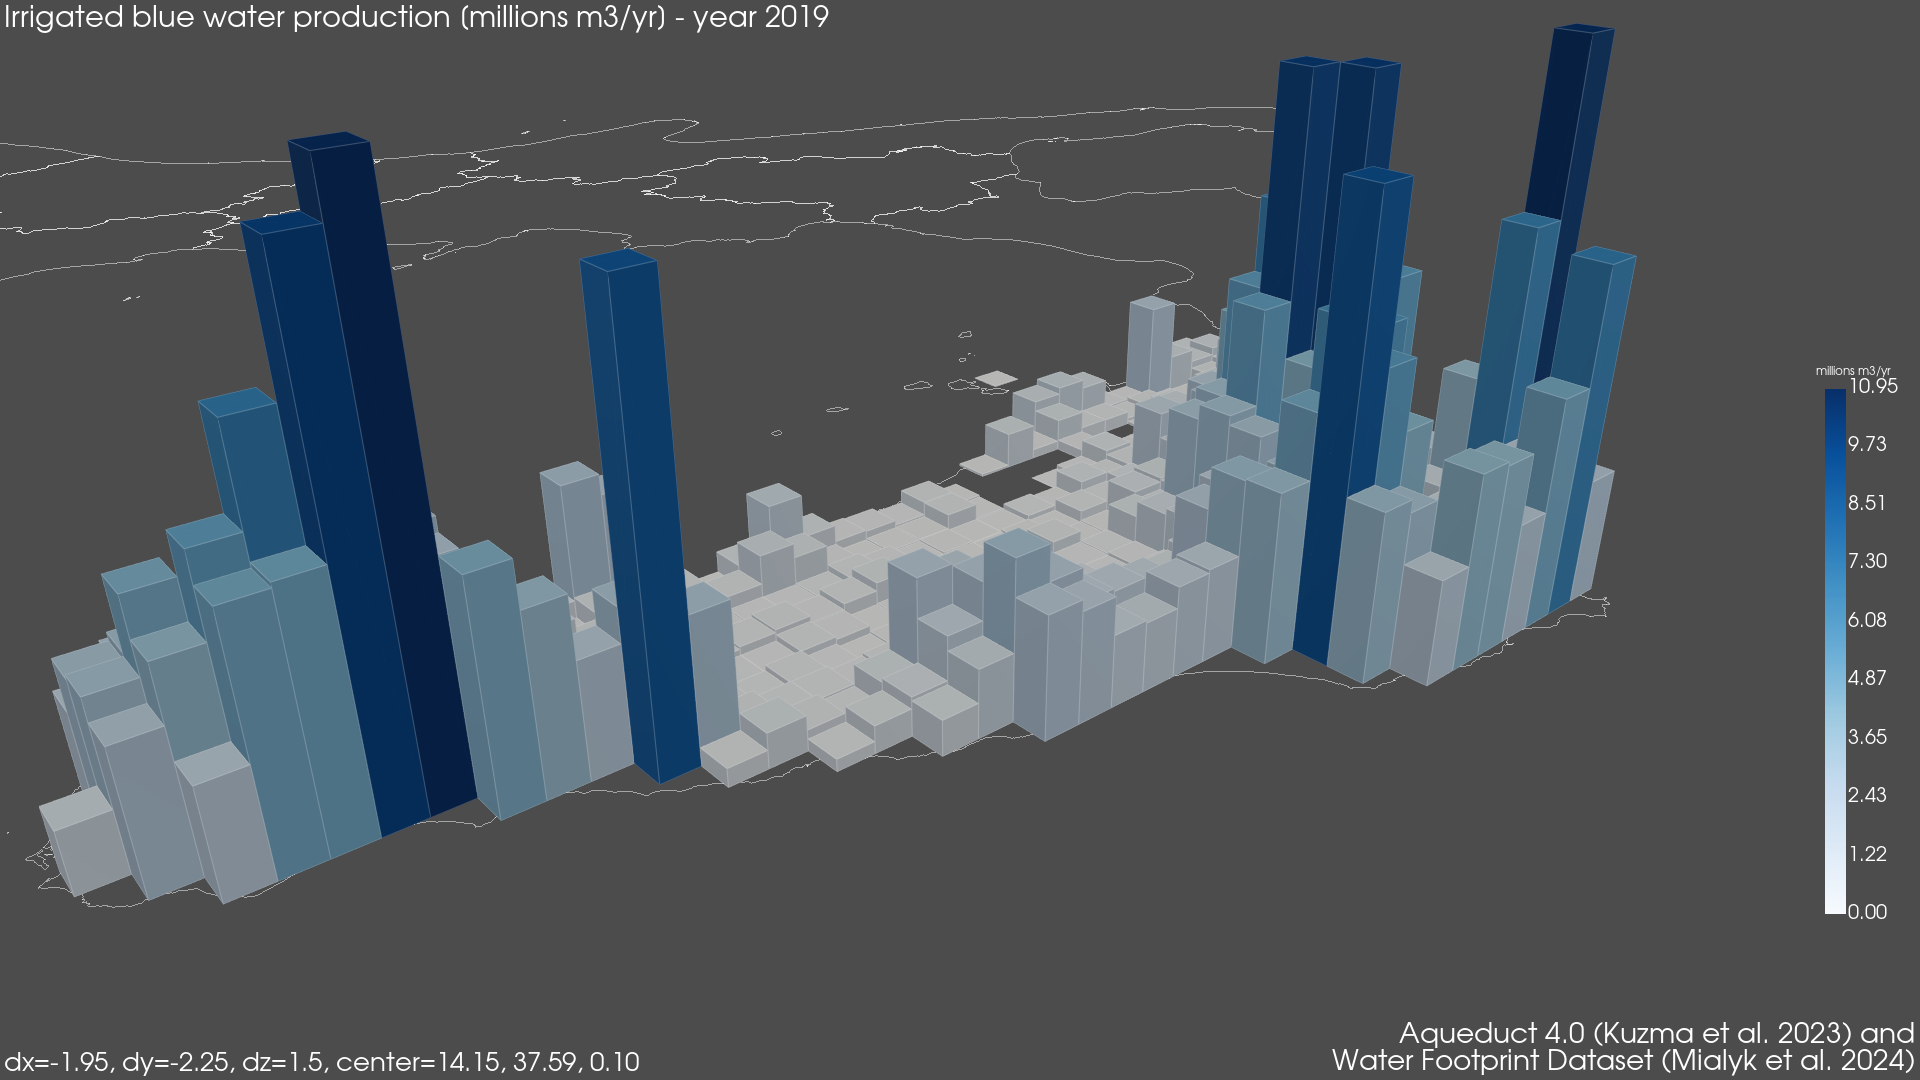
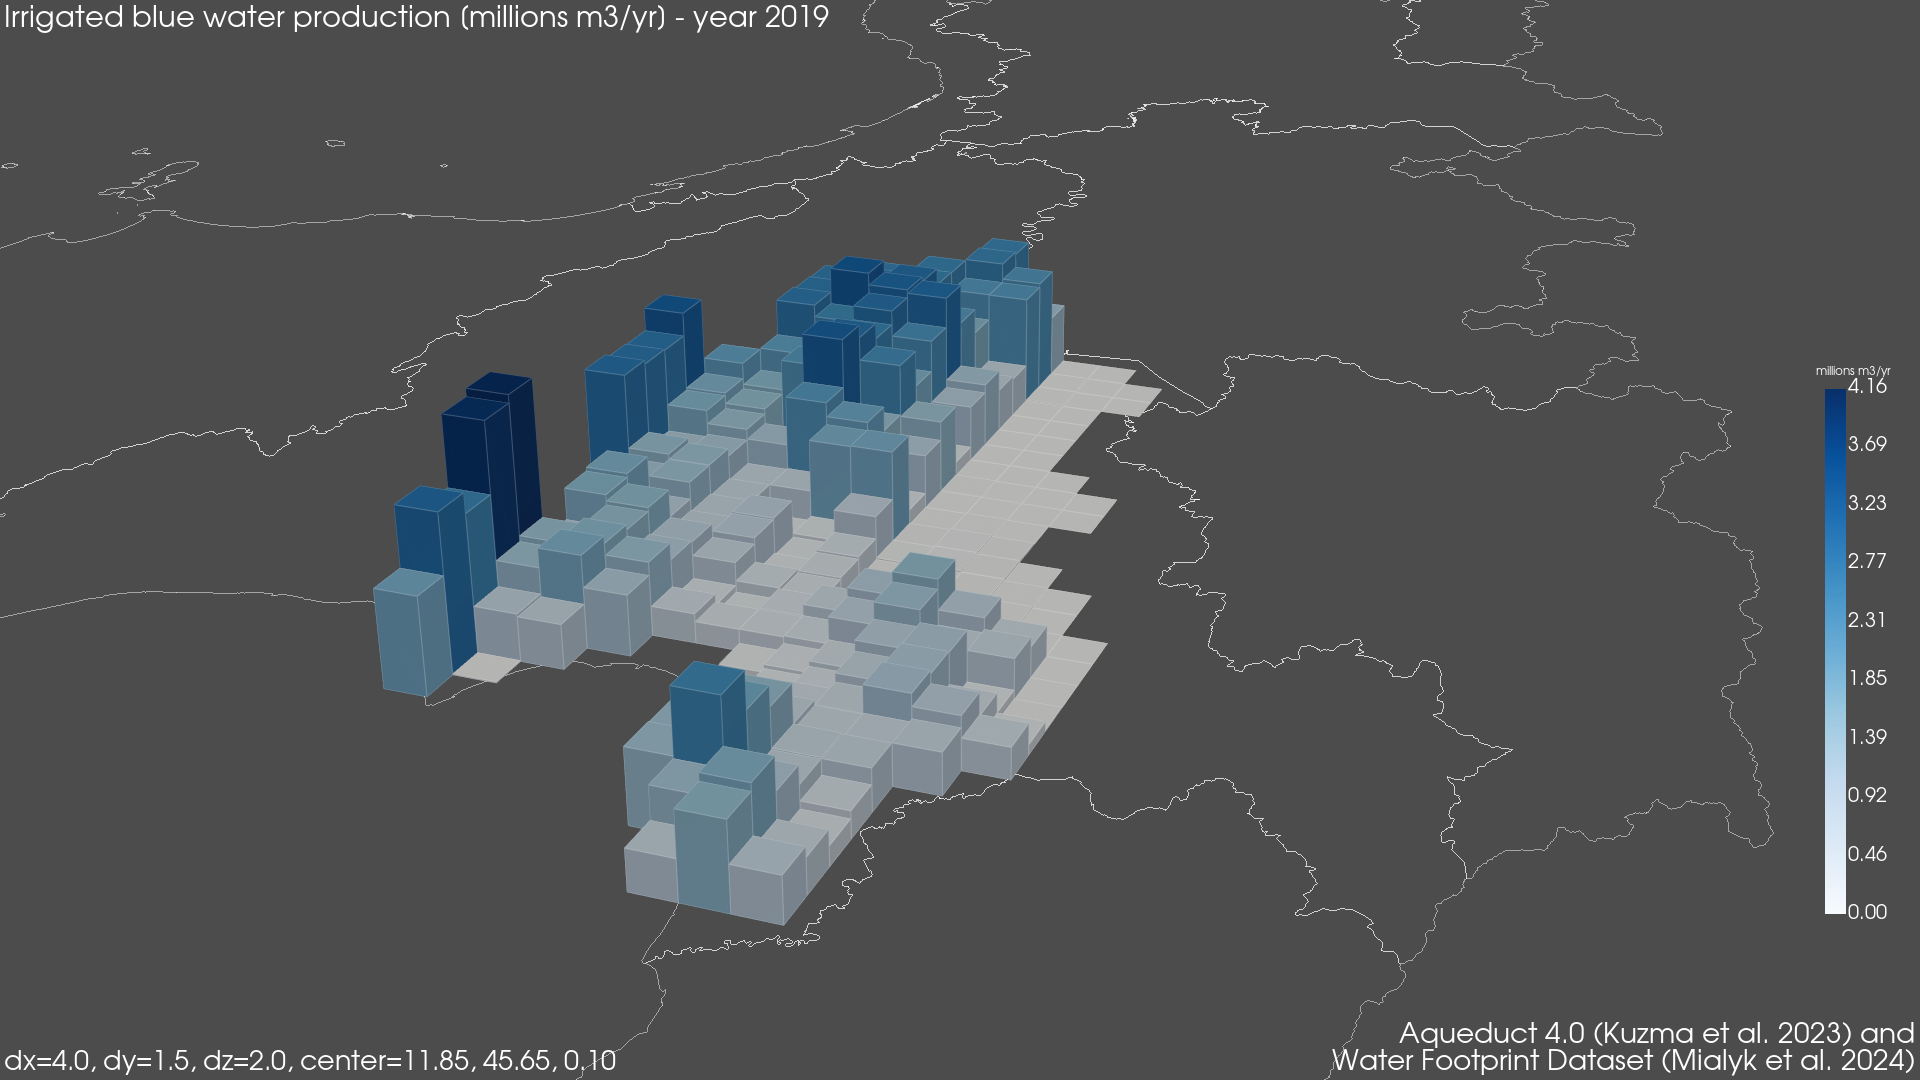
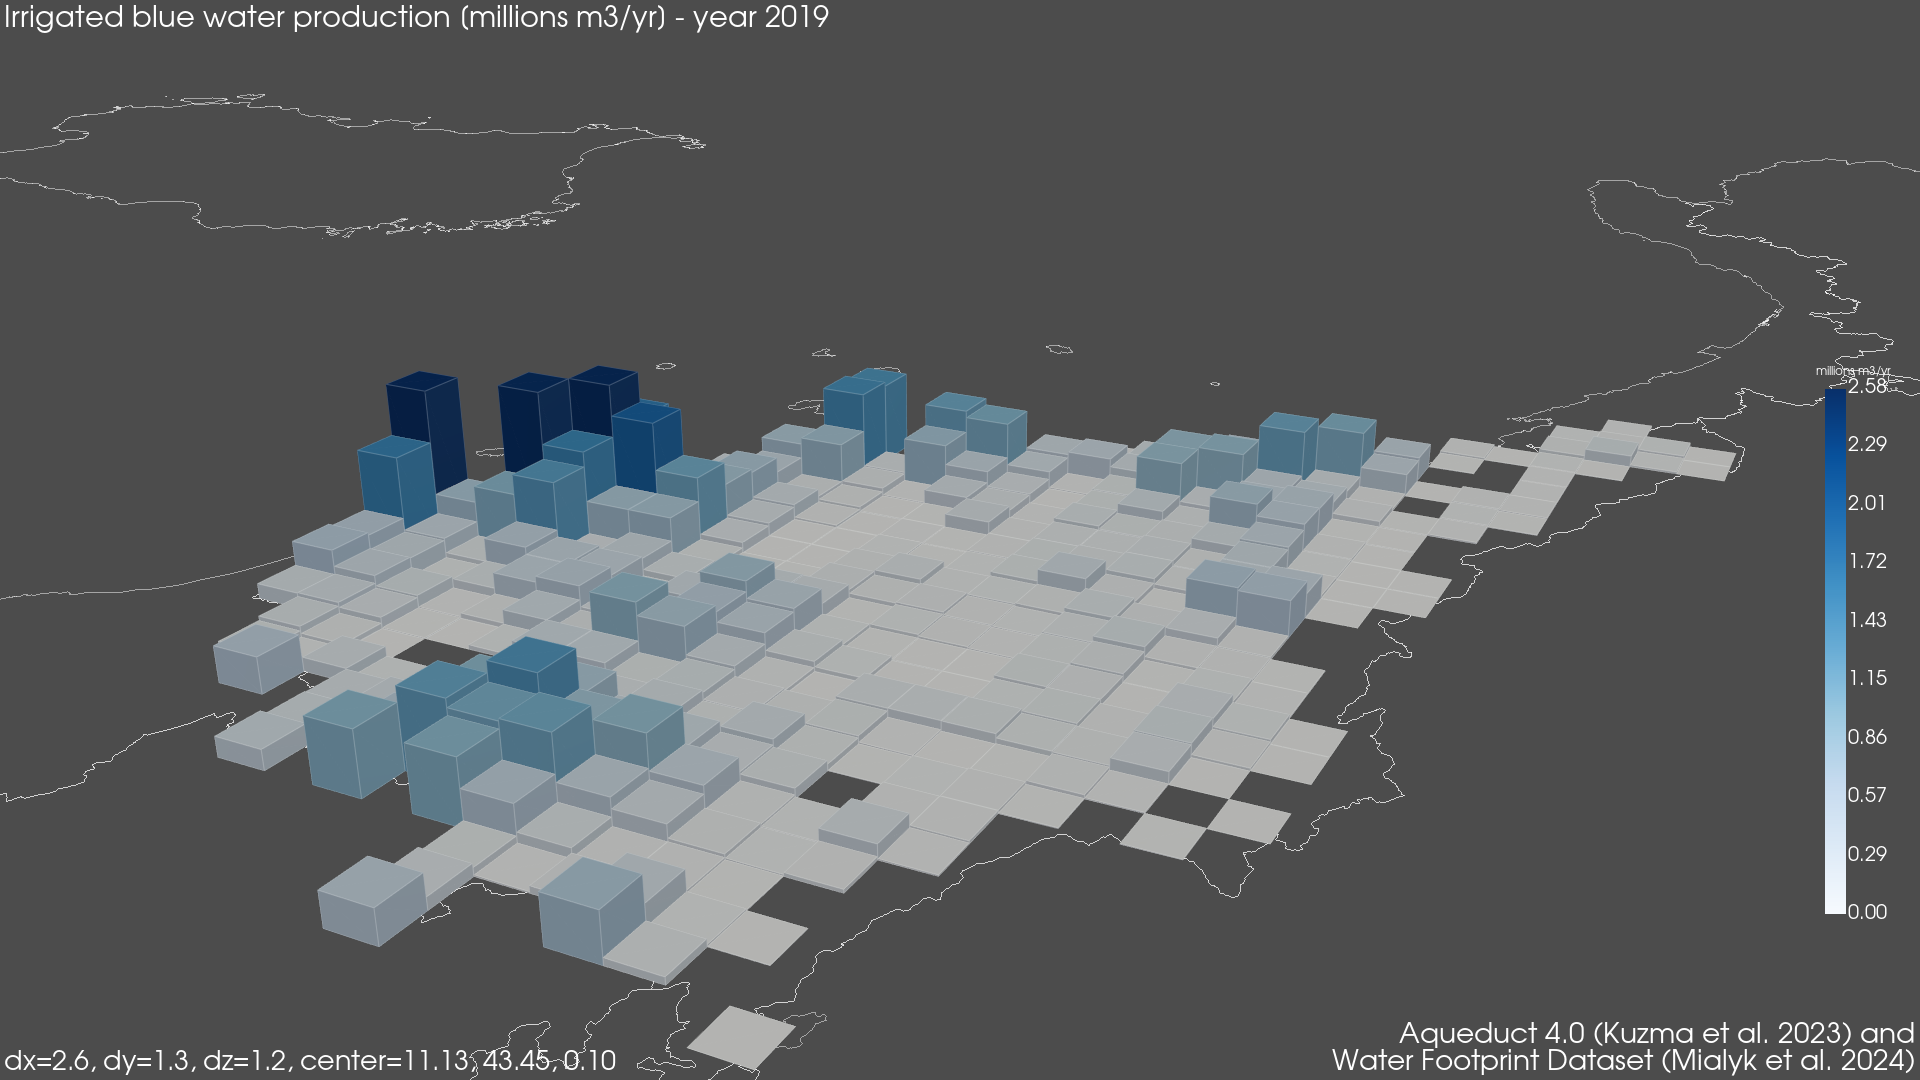
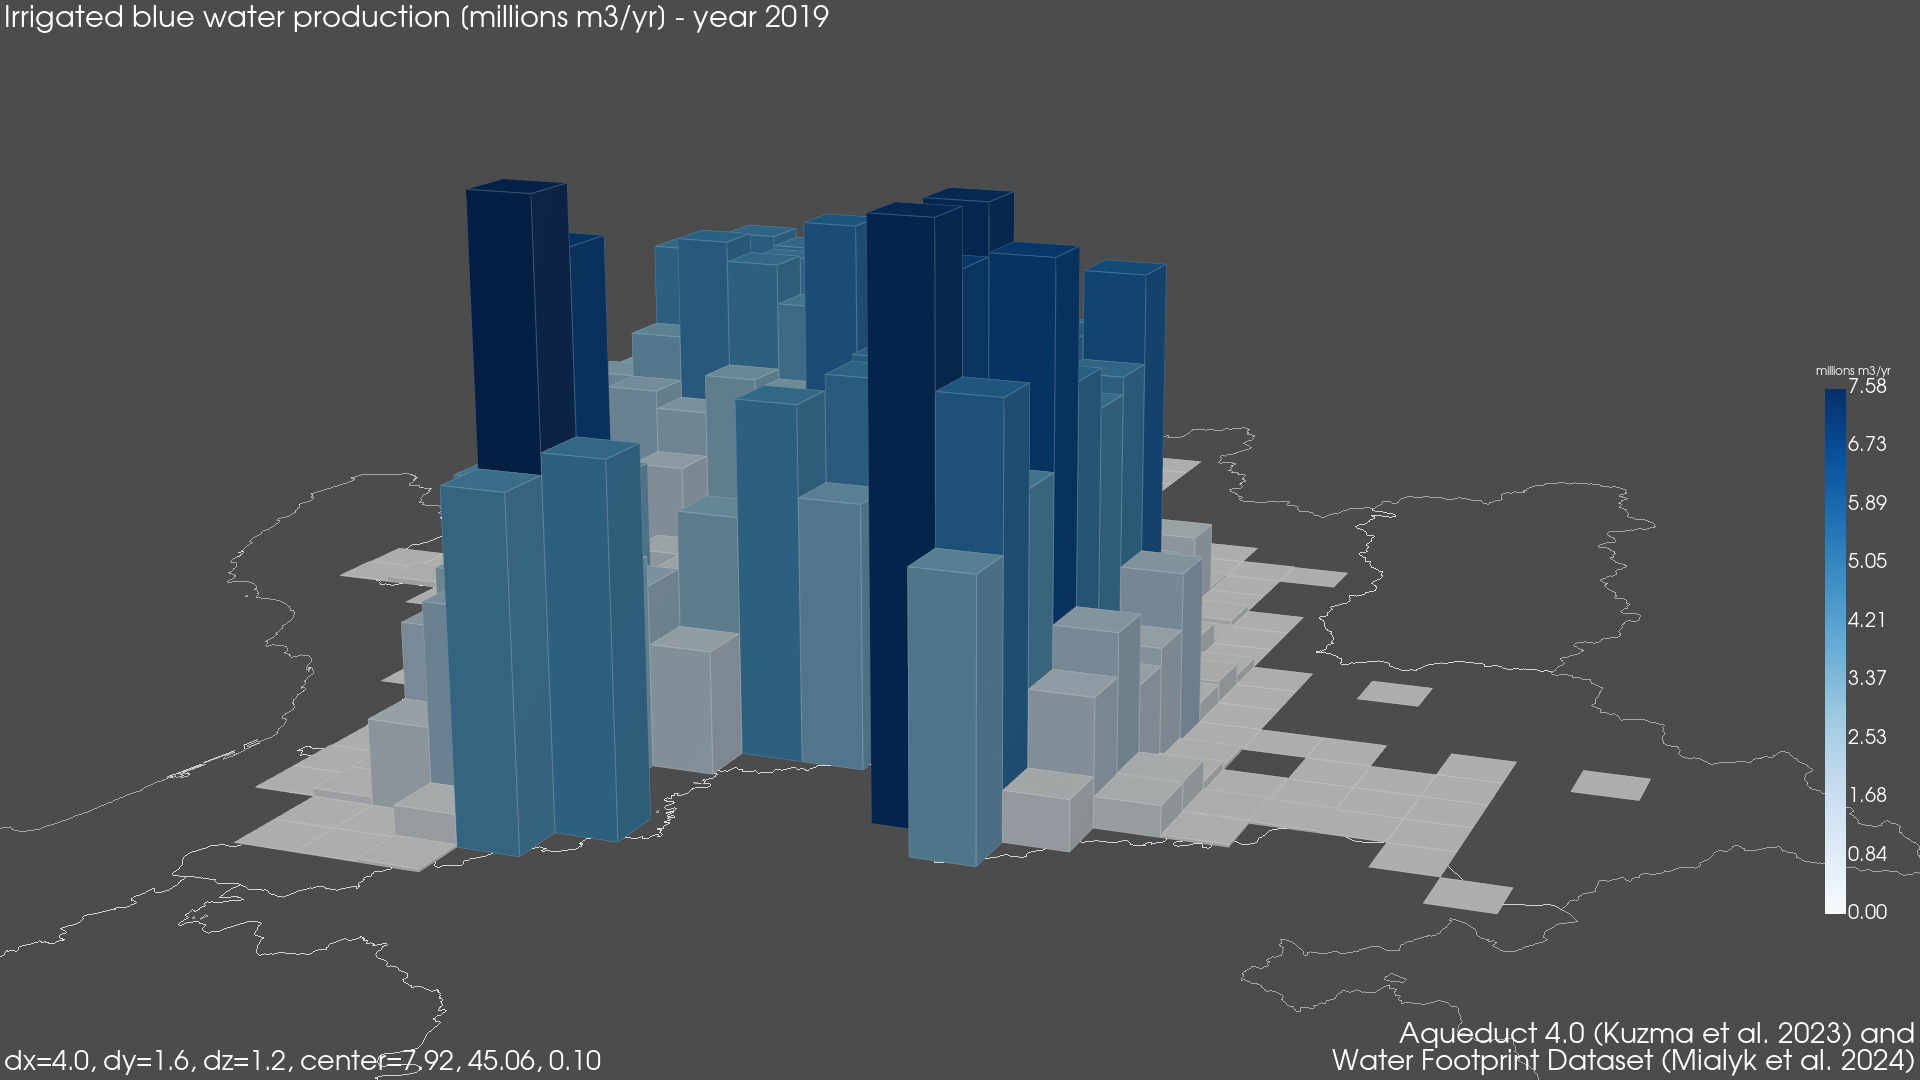
Regional Isometric Maps for Italy showing Blue Irrigated Water Footprint
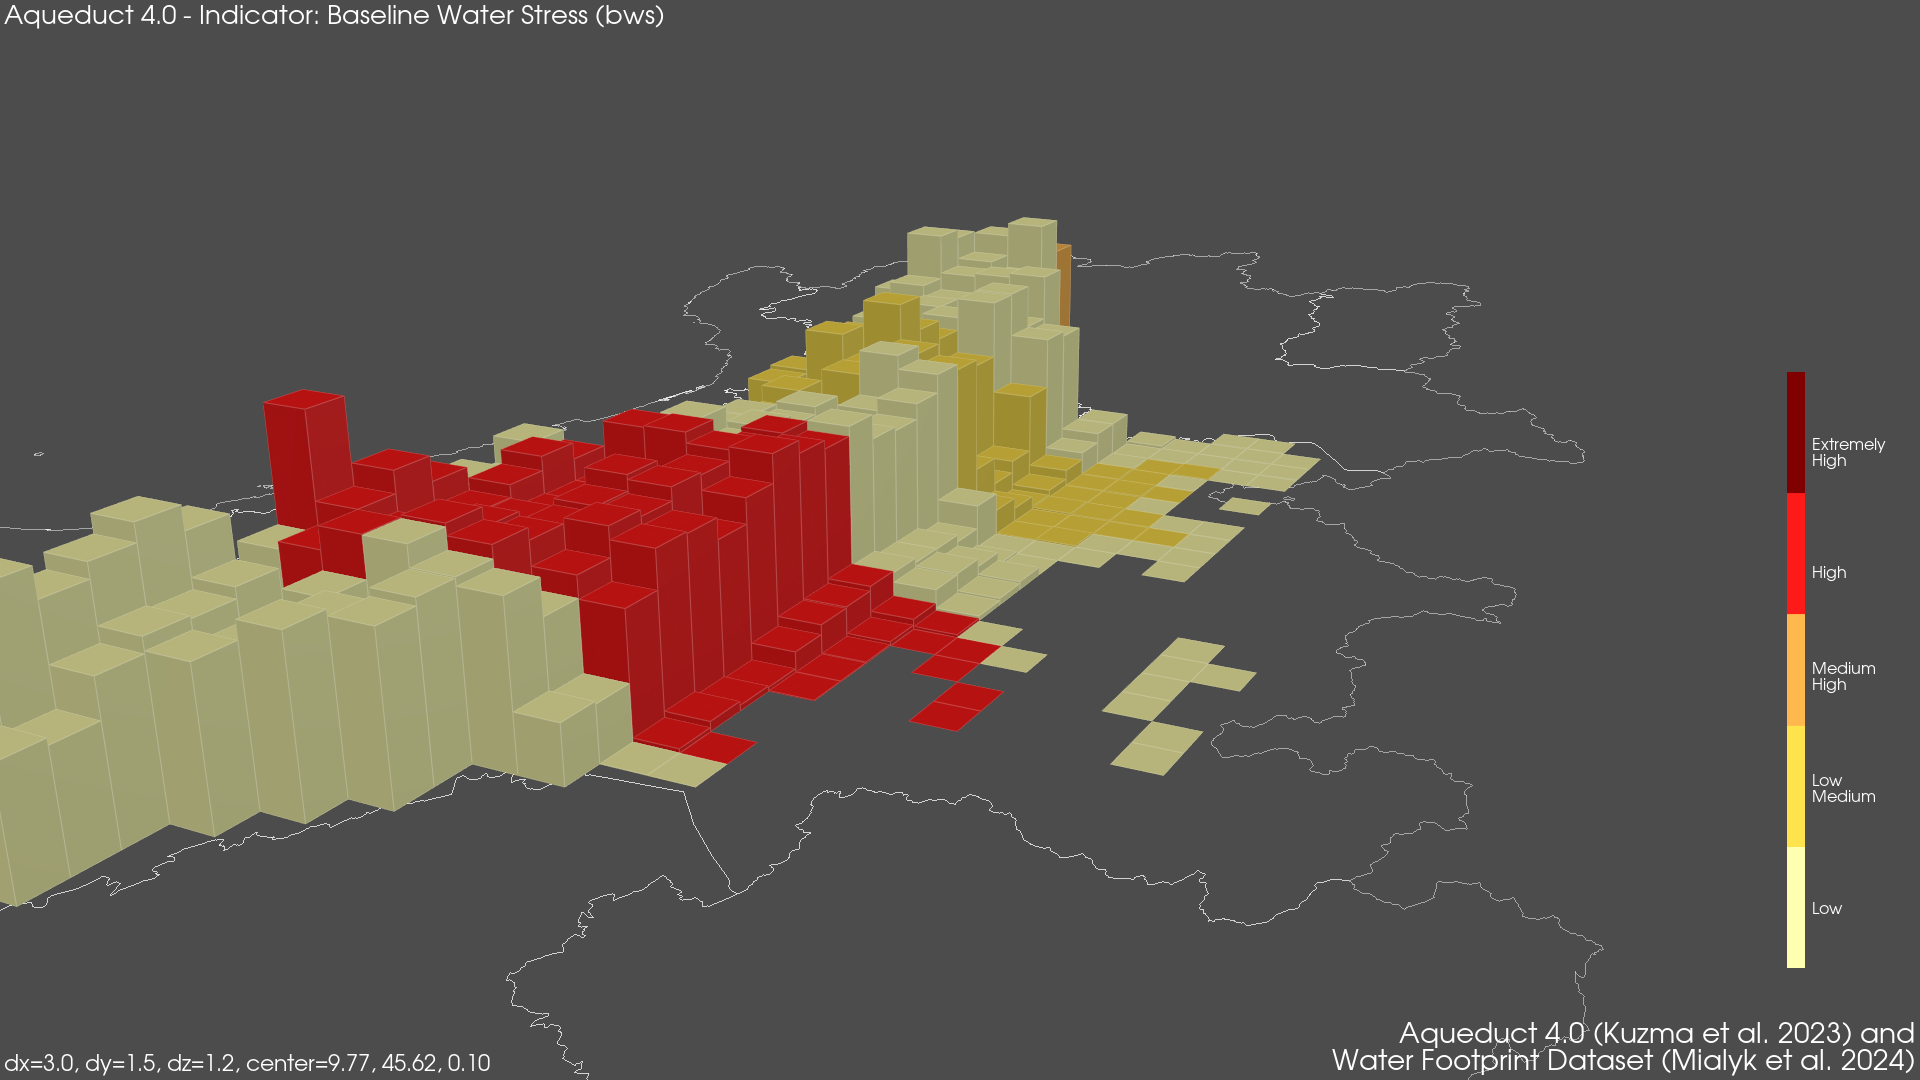
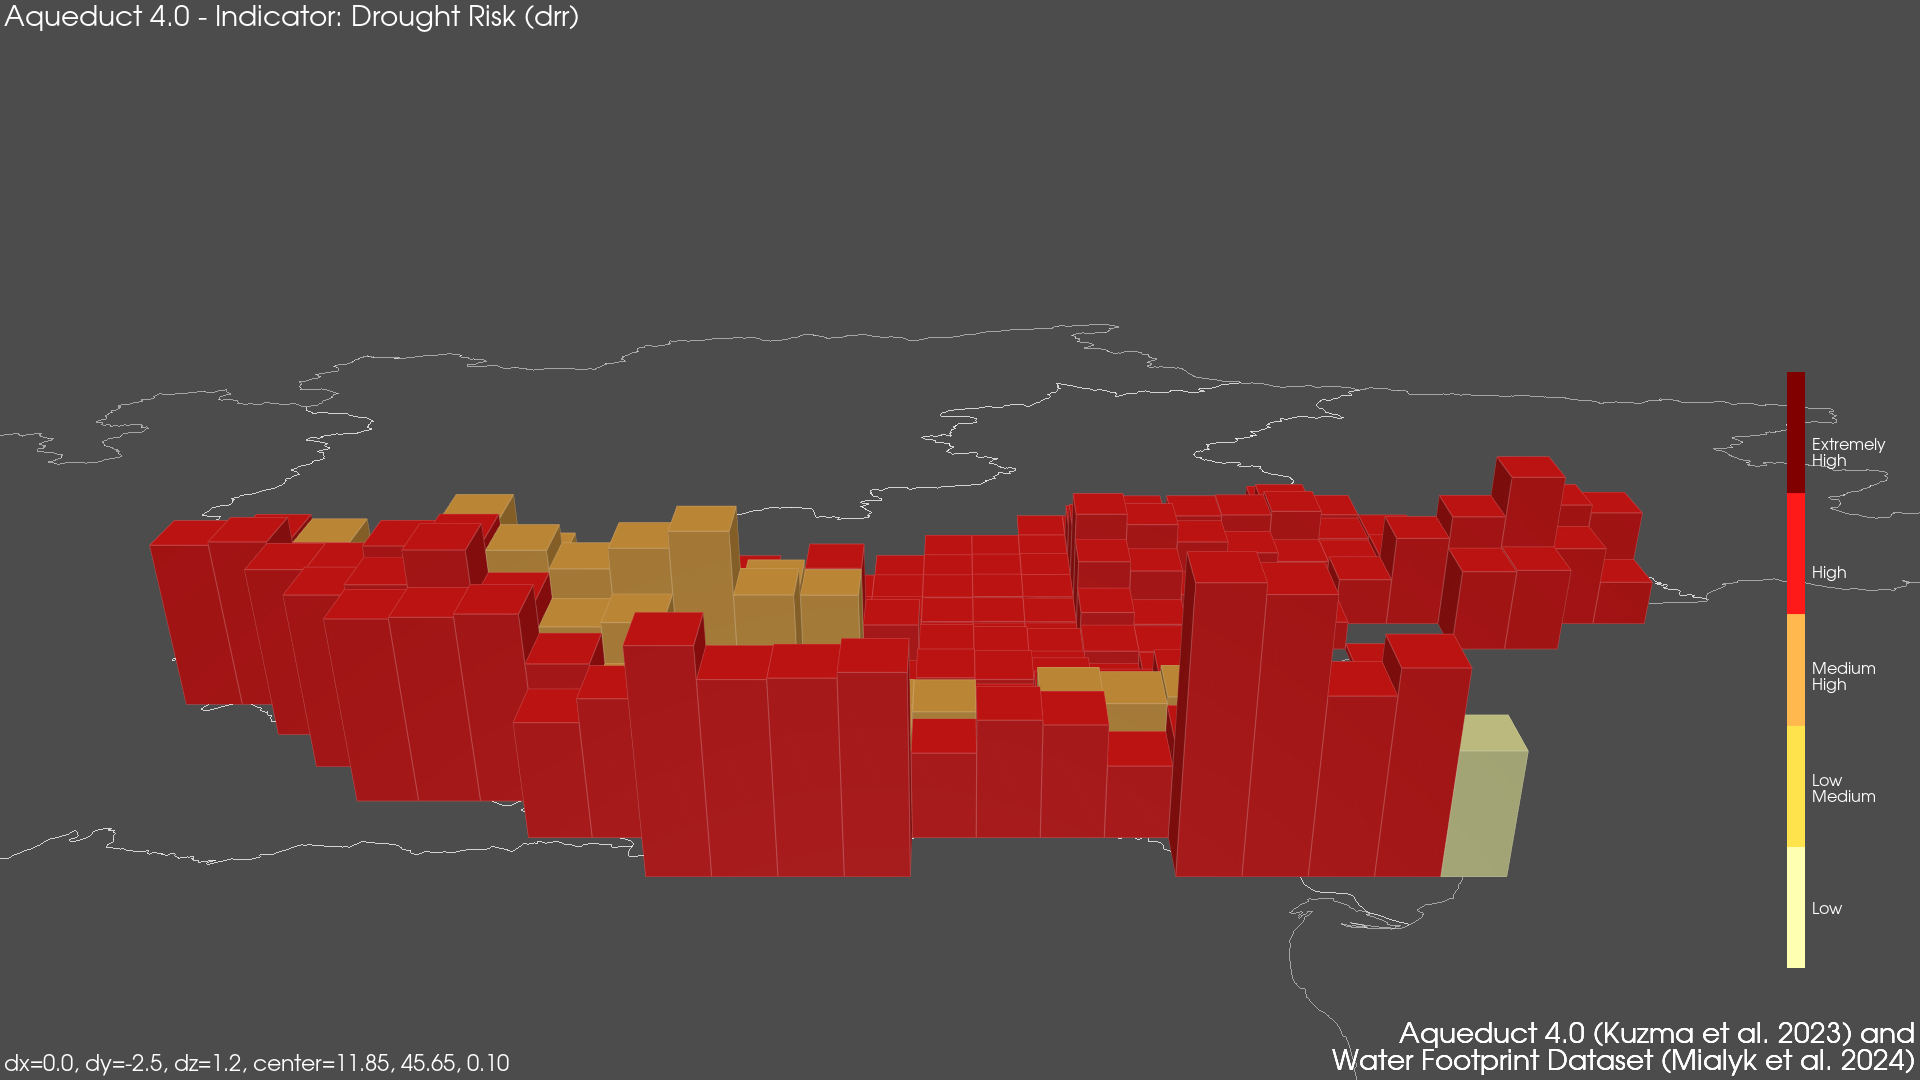
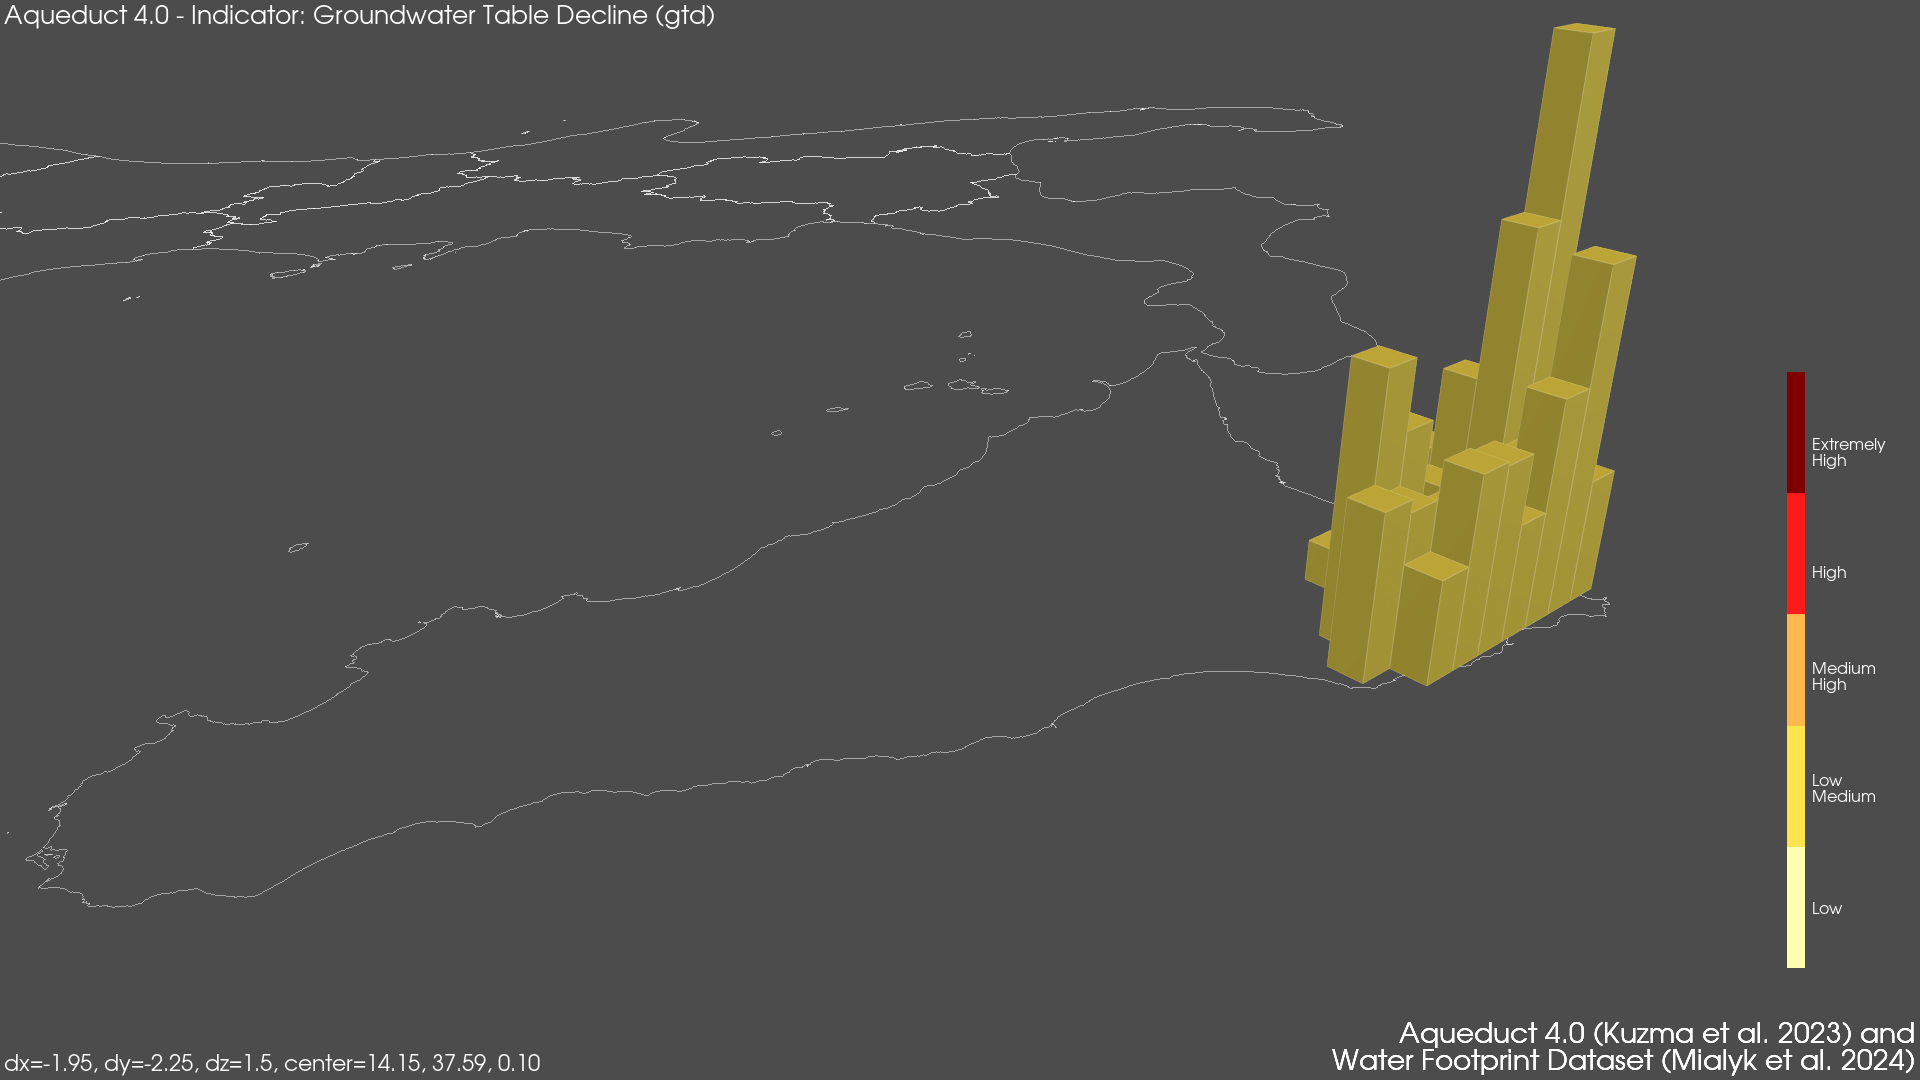
Regional Isometric Maps for Italy showing Water Stress, Drought Risk and Grounwater Table Decline
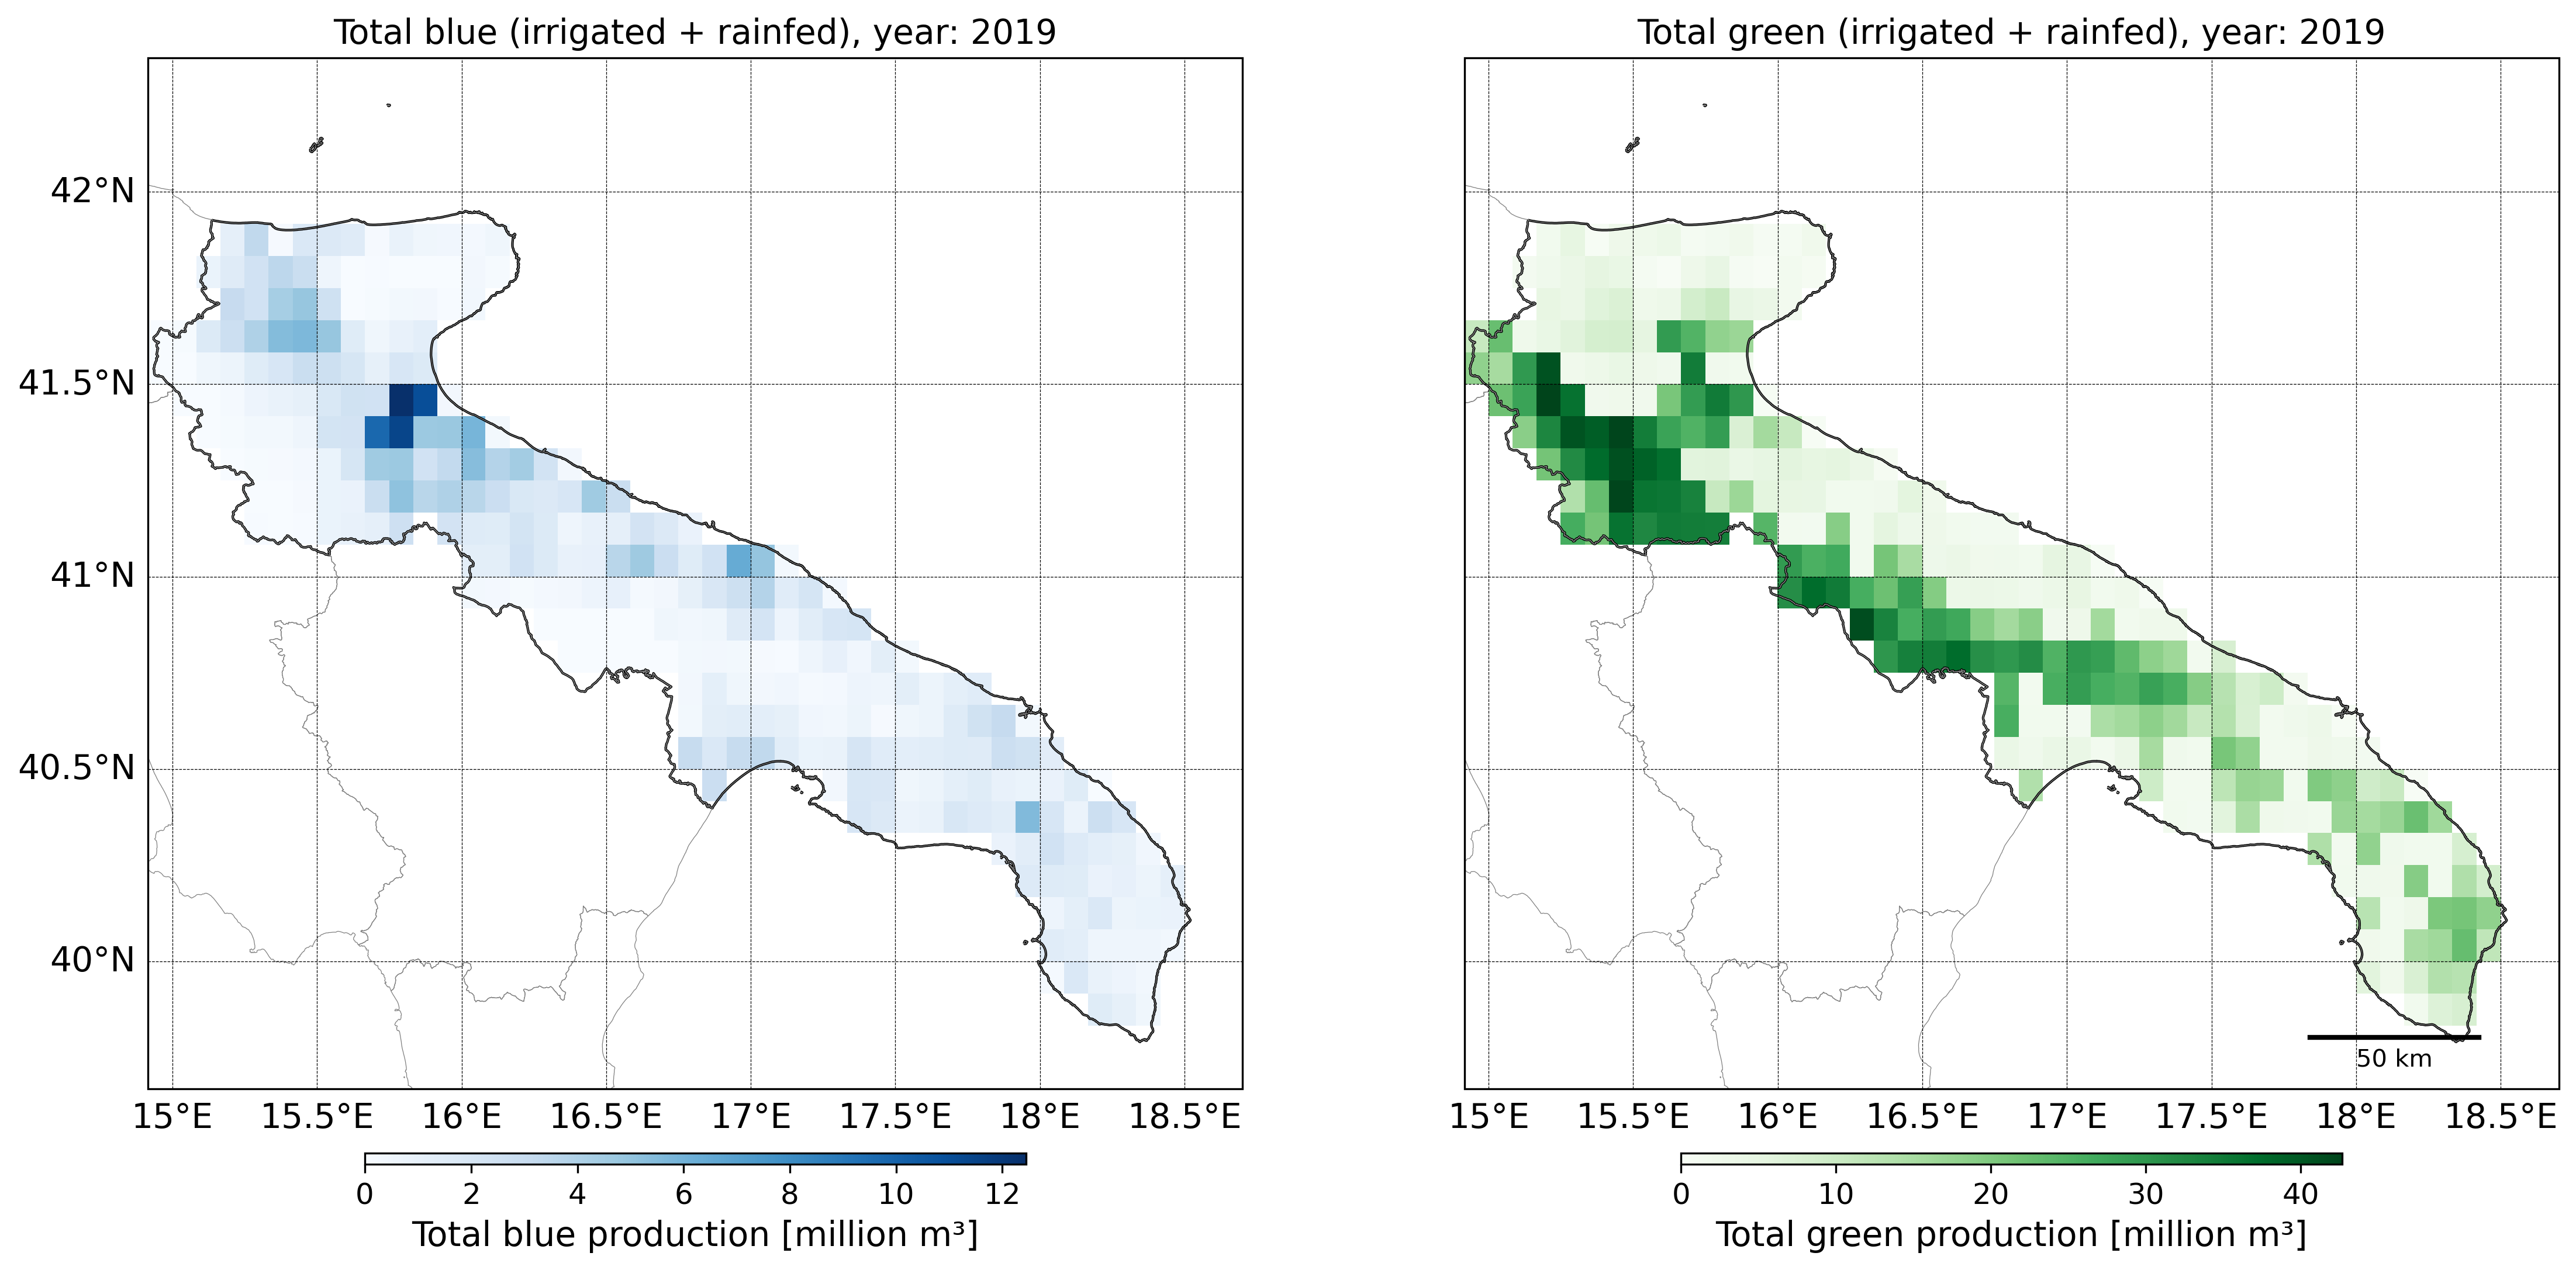
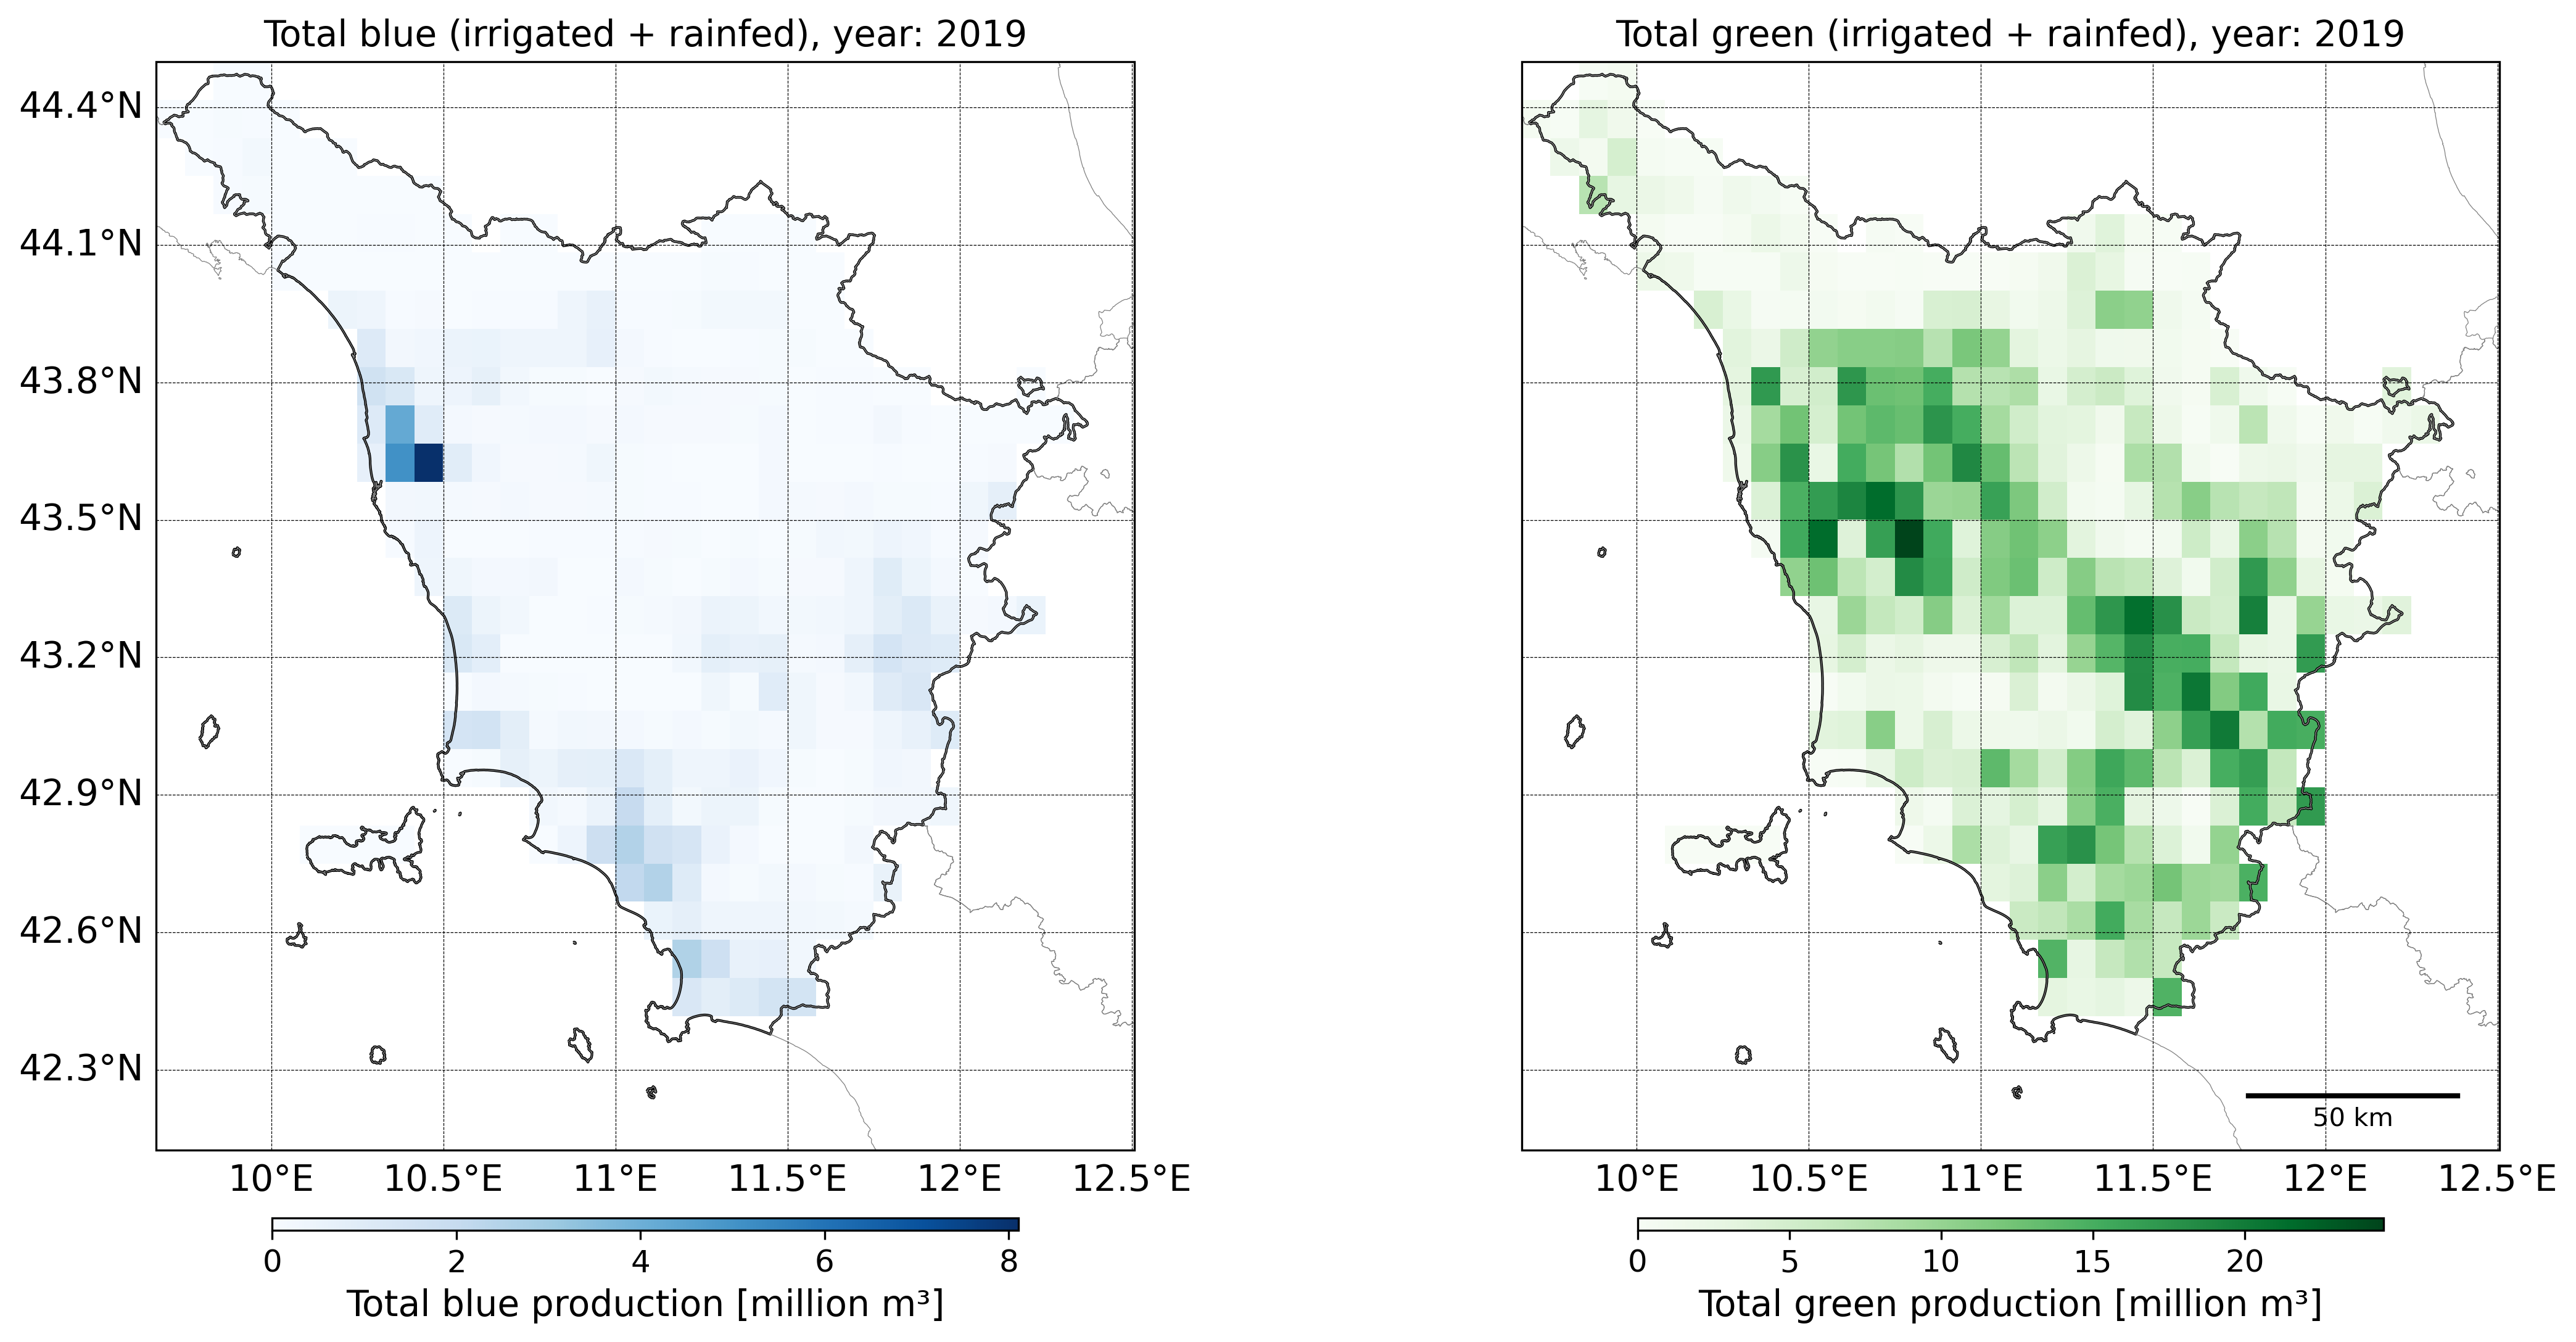
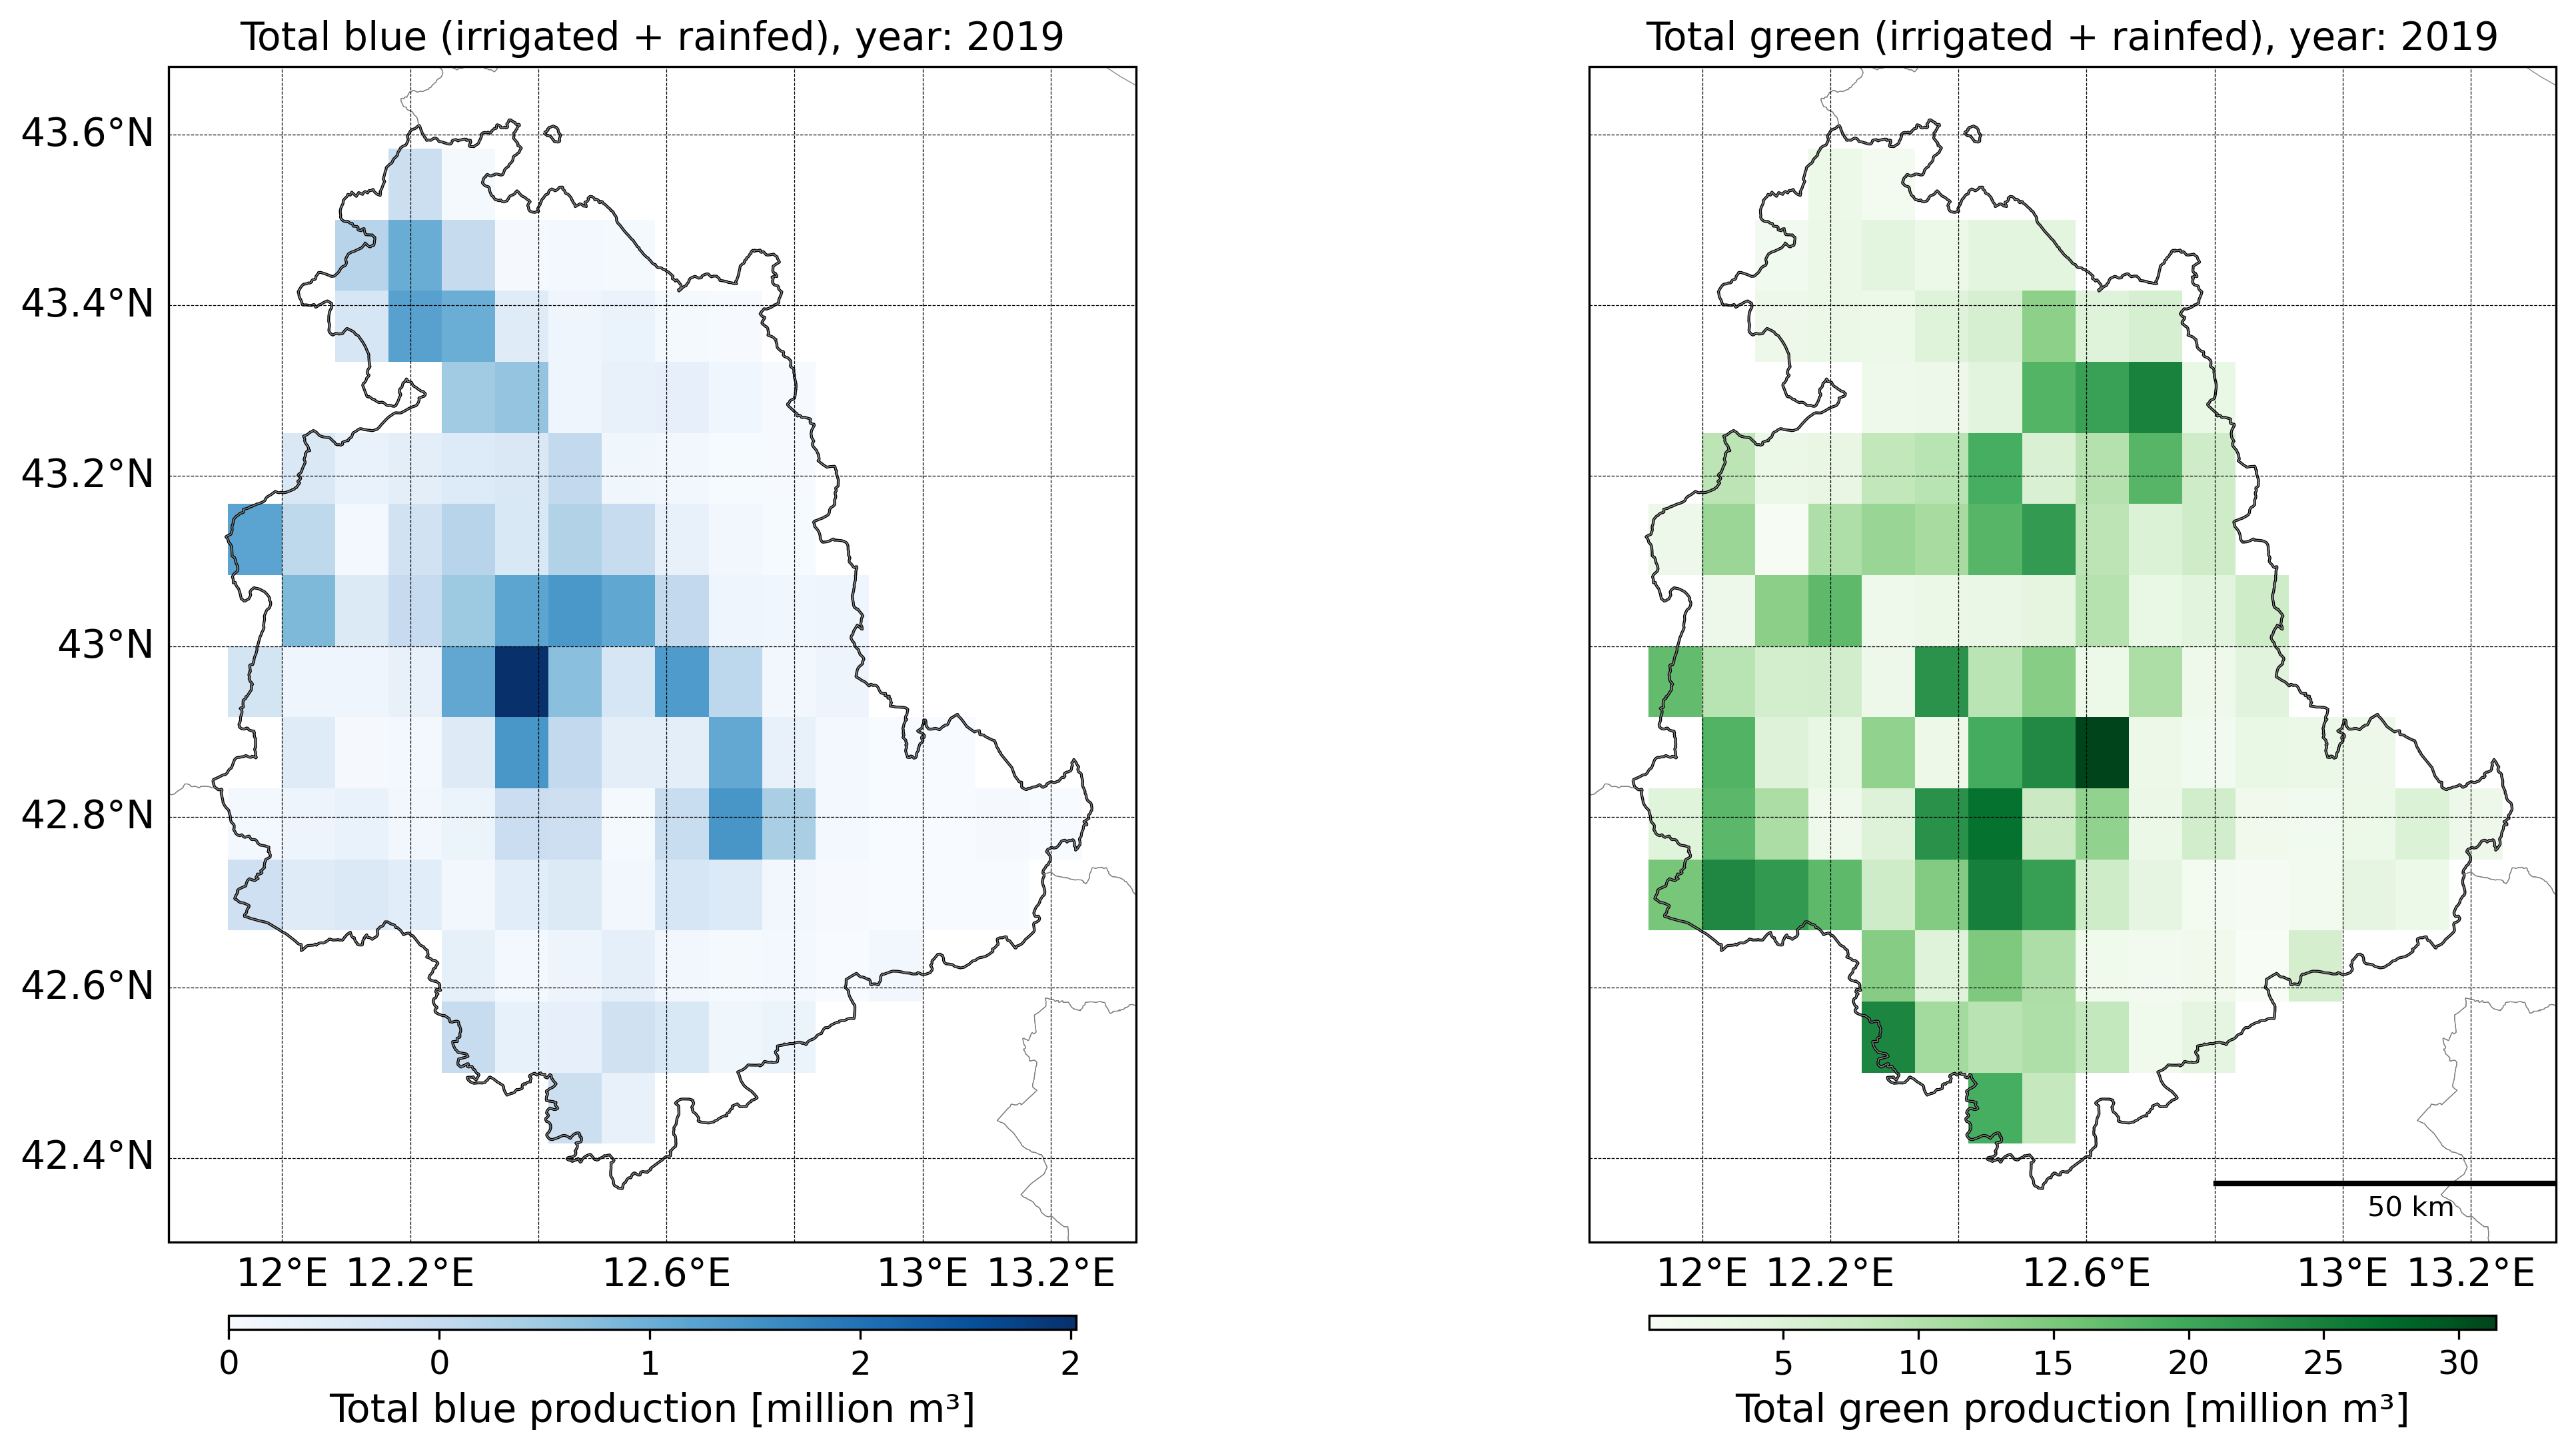
Regional Total blue , total Green and total (blue+green) water footprint of production
Main sources
- Mialyk, O., Schyns, J. F., Booij, M. J., Su, H., Hogeboom, R. J., & Berger, M. (2024). Water footprints and crop water use of 175 individual crops for 1990–2019 simulated with a global crop model. Scientific Data, 11(1), 206.
- Kuzma, S., Bierkens, M. F. P., Lakshman, S., Luo, T., Saccoccia, L., Sutanudjaja, E. H., & Van Beek, R. (2023). Aqueduct 4.0: Updated decision-relevant global water risk indicators. World Resources Institute. doi:10.46830/writn.23.00061
- Greco, F. (2025). JustWATER. GitHub, Zenodo
×
![]()